
Conversion rates have been a TESTING tool. For example, you make a PLAN. And want to test it.
CONGRATS! No need to exert extra effort. Conversion rates have saved you. Test the MARKETING strategy. Make landing pages. And check the conversion rates.
Better conversion rates give a GREEN SIGNAL to your strategy. And boom!
You can try it.
In the THIRD QUARTER of 2023, the beauty industry leads the conversion rate graph. Guess the rate? It is 2.7%. (Source: statista)
Want to know how other industries are performing? Read the complete guide about conversion rate optimization.
General Conversion Rate Optimization Statistics
Conversion rate is of PRIME importance for the businesses. For example, you want more consumers visiting your website. And it is 100% ESSENTIAL, not just to let them see. But also compel them to purchase the products or services you are offering.
But can you guess what the data says? If so, let me tell you what exactly the data says about eCommerce business conversion.
Here are some E-commerce conversion rate optimization stats.
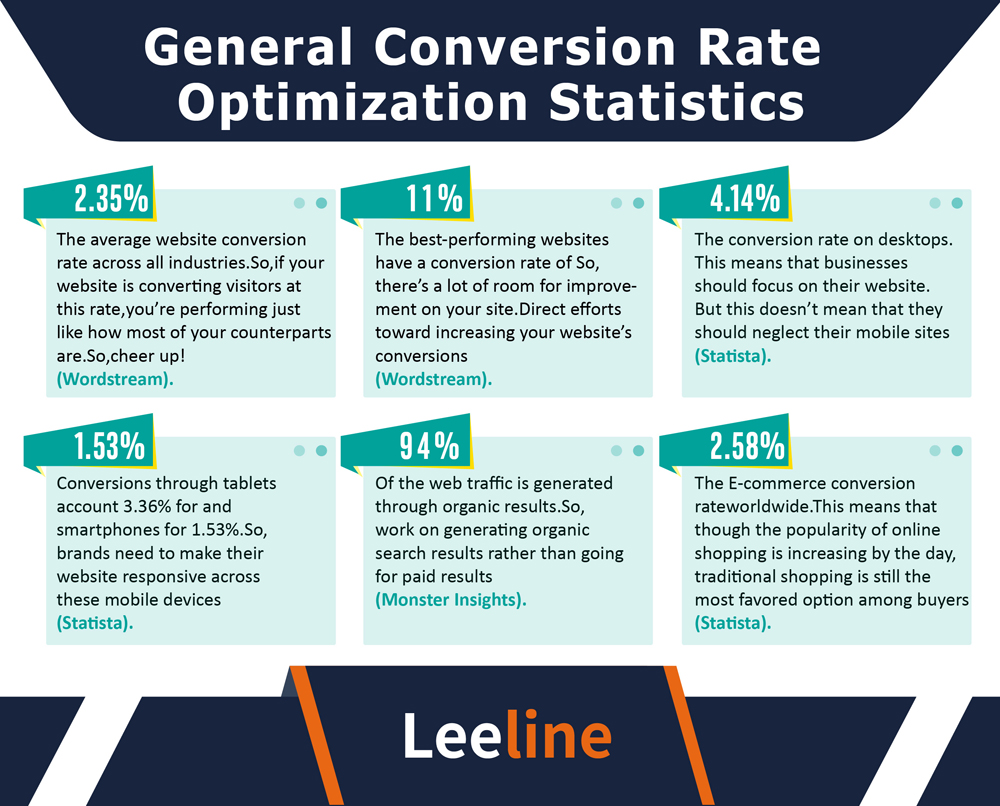
- The average conversion rate in all the INDUSTRIES is about 2.35%. That means if someone is GRBABING 3% or more conversion, great! What else can be better than this?
- 11% is the BEST conversion rate of the top-performing industries. Grabbing a conversion rate at this level puts your BUSINESS into top-performing.
- Desktop has been one of the best ways for the BEST conversion rates. That is why 4.14% has been the TOP conversion rate for desktops. Businesses have to FOCUS on their website optimization for better results.
- Mobile and tablets have been behind the desktops for the CONVERSION rate. Surprisingly, the tablet conversion rate is 3.36%. It is pretty remarkable compared to mobile optimization. It has a conversion rate of 1.53%. Businesses do not have to focus on the desktop and smartphone views. It helps them further optimize the website.
- You might wonder whether it is essential to choose the ORGANIC traffic or paid. Data suggests focusing on better content. And drive the organic results. 94% of the TRAFFIC comes from the organic search compared to 6% from the paid results.
- The worldwide conversion is not significant. You get an AVERAGE conversion rate of 2.58% of the TOTAL conversion. Even online shopping is popular. Still, the data FAVORS offline shopping. However, businesses have to focus on the BEST services for better conversion.
Landing Page Conversion Rate Optimization Statistics
Guess what causes the Highest conversion rates? It is the MAGIC tool— LANDING pages. These are the pages to which the website owner directs the users. There are long-form landing pages and SHORTER landing pages. It depends on what is the best approach as per the data.
Take a look at the best conversion rates!
- A landing page is a POWERFUL tool if you use it better. Long-form landing pages are not AS effective as shorter landing pages. They generate 2.35% conversion on average.
- The less the forms, the better the conversion. If a LANDING PAGE has 6+ forms on its page, great! It has a 15% higher chance for the conversion rates.
- If you reduce the LANDING pages form to less than 6, it is better. It has a 20% conversion rate for PAGES with 3-5 forms.
- If there are less than five pages, that would be even better. Do you know why? Because the test conversion rates showed an increase of 25% conversion. Pages with 3 form fields have 25% more conversion than other pages.
- The number of landing pages is also significant. Increasing the LANDING pages to 10-15 can increase conversions too. It has an increased conversion rate of 100%.

Conversion Rate Optimization Spending Statistics
Businesses are SPENDING millions of dollars on conversion rate optimization tools.
Why?
It is because of the endless benefits they get from the conversion rate. Increased conversions mean an INCREASE in their sales. And it leads to higher business chances.
But there is still one question in mind;
How many percent of businesses have done so? Want to know? Check vital conversion rate statistics.
- Most of the businesses have INCREASED their budget for the conversions. About 55.5% of the companies have done so. They spend money on the LANDING pages. Invest in paid advertising campaigns. And optimize the business DEALS and get more conversions.
- 40.7% of the businesses have KEPT their budget the same. And that is still a positive sign.
- Some companies have also reduced their budget for the optimal conversion rate. That is a SMALL amount of companies, around 3.8%.
- The irony is that most customers are spending more on the customer ACQUISITION. For example, companies around $1 on the conversion compared to $92 on the ads. That is a BIG difference between the ads spend and Conversion. Businesses have to FOCUS more on the conversion rates.

Conversion Rate Optimization Testing Statistics
Conversion rate TESTING IS essential for a business.
How?
Let me tell you how. Suppose a BUSINESS has launched a new product. It is time to ensure whether the product or its prototypes can generate sales. The testing process helps businesses check the CONVERSION rate of that product. If that is more than 3%, it is AMAZING. However, 2.5% is still a GOOD range.
Such testing processes help save money while launching excellent products only.
Companies have spent a LOT on different testing types. Check the popular ones.
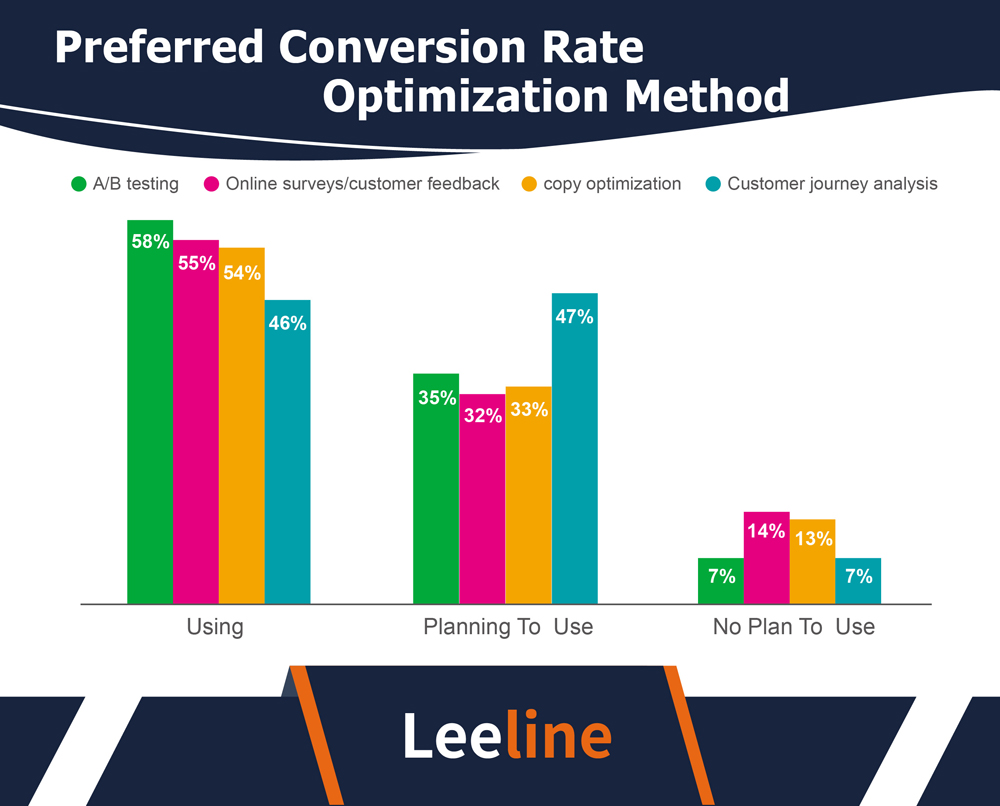
- A/B testing is the MOST popular testing method for lead conversion. 58% of the businesses use it.
- Customer feedback and SURVEYS are very crucial. 55% of the companies use it to test the CRO.
- Copy optimization is the THIRD MOST used CRO method. 54% of the companies use it.
- Customer journey is the 4th most POPULAR tool for testing conversion rates. 46% of the businesses use it.
- Some companies are planning to use all of these tools. 47% plan to use the CUSTOMER JOURNEY analysis. 35% are focusing on the A/B Testing method. 33% are planning to use COPY OPTIMIZATION. 32% are planning to use customer feedback for their CRO strategy.
Conversion Rate Optimization Devices Statistics
Guess who is the winner of CONVERSION? Make a rough guess. Is it desktops or mobile devices? Maybe you are thinking about the HIGHEST average conversion rate on mobile devices.
But it is astonishing to know;
Mobile devices are LAGGING. Desktop has taken the lead in average conversion rate.
Here are the complete details.
- Desktop is the number 1 site for more conversions. It has an average conversion rate of 4.14%.
- Tablets are even BETTER For an average conversion rate. It has a SECOND rank among most conversions. It has an average conversion rate of 3.36%.
- Mobile phones are the THIRD MOST popular for the high conversions. It has an AVERAGE conversion rate of 1.53%. That is less than other devices. But you shouldn’t ignore CONVERSION rate optimization on mobile phones, too.
- Other devices have the LOWEST conversion rate. It has a rate of 0.05% conversion rate.

Conversion Rate Optimization Software Statistics
Do you use the conversion rate optimization SOFTWARE? If yes, great. They can optimize the OVERALL conversion rates.
How?
They help in testing the strategy. Make the right plan. And push them to ensure a better optimization plan.
Important conversion rate statistics show how tools increase CONVERSIONS. Check them out!
- 74% of the TESTING splitting is EFFICIENT. They help businesses optimize their CONVERSIONS. And improve their strategy.
- 44% of the COMPANIES use different tools for A/B. And it has been very successful for them to get higher conversion rates.
- CRO tools can improve the ROI. Some businesses have noticed a GREATER increase of up to 223% ROI.
- 55% of the companies are ALLOCATING the budget for CRO software. It will help them get more conversions in the FUTURE.
- 48% of the companies don’t use the TOOLS. They don’t think it helps them improve the conversion rates.
Conversion Rate Optimization Strategy Statistics
Do the businesses have the OPTIMIZED strategy? Not all companies have an OPTIMIZATION strategy.
A strategy is necessary to set up a plan. And achieve the targets on time. Here is the complete data list about the CRO strategy.
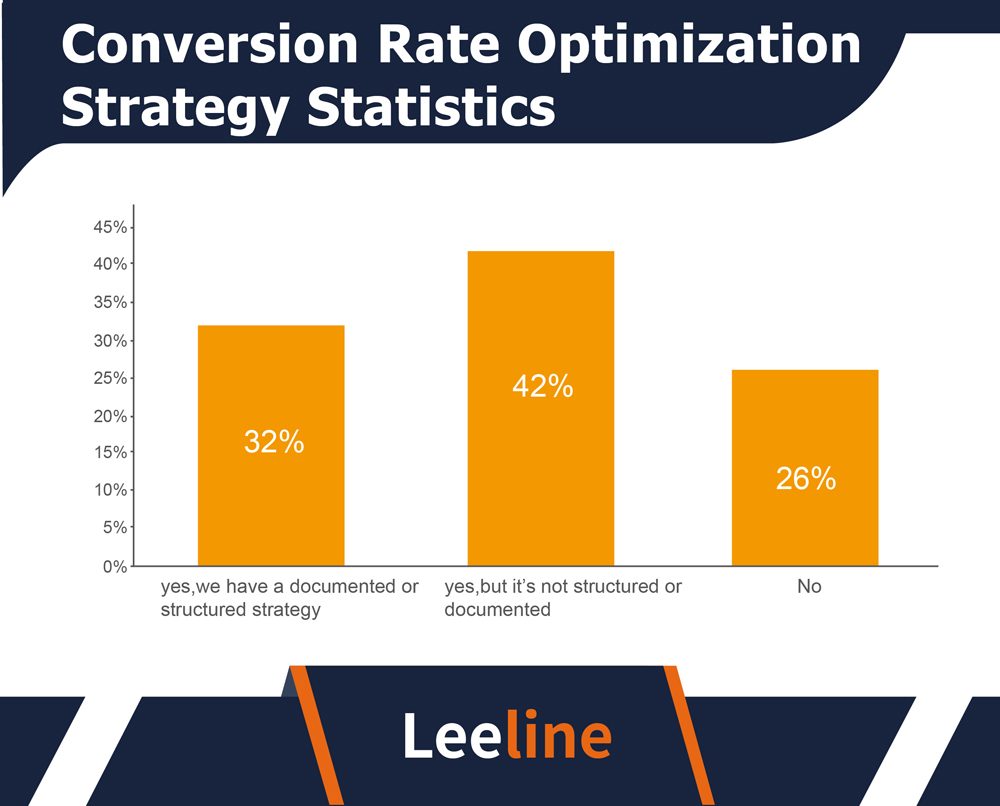
- 32% of the businesses have a CRO strategy. It has a PROPER plan and structure. And helps them get the targets on time.
- 42% of the businesses said YES to the strategy. But they do not have a well-structured and DOCUMENTED process.
- 26% of the businesses said a CLEAR no to the CRO strategy. In the future, they might have a PROPER plan.
Average Conversion Rate Optimization Statistics
Paid search has been a MAGICAL way to optimize conversion rates. Paid search converts every 3.2 visitors on a NEW LANDING page. And it is astonishing if you are WONDERING about the conversion.
But if we divide the conversion among different industries, you get the following data.
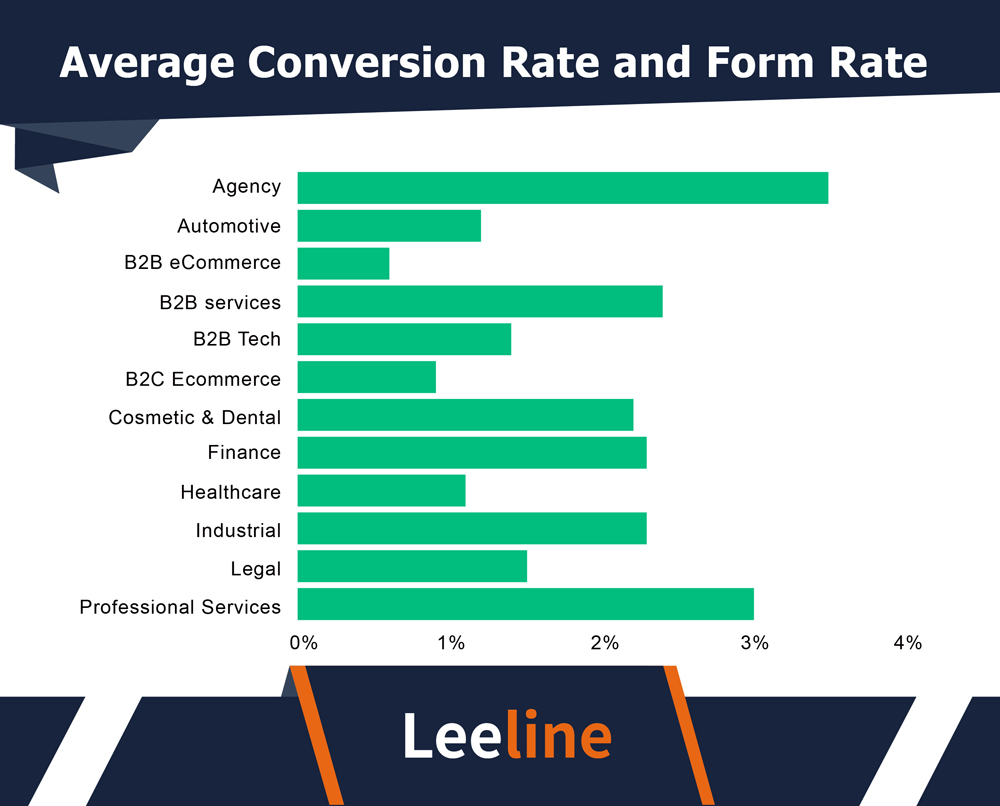
- The agency is the BEST industry. An agency often offers professional services to the customers. It has a HIGHEST conversion rate of 3.8% among all.
- Professional services come on the SECOND rank for paid conversions. And it has almost 3.1% compared to other industries.
- B2B services have a DECENT ratio of conversion. It has a conversion rate of 2.8%.
- The finance and Industrial sector has almost the SAME stats. It is 2.4% of the conversion for the PAID ads.
- After that, here comes the COSMETIC and DENTAL services. These have a conversion rate of 2.3%.
- Legal services are also at the top for the conversion rates. It has a RATE of 1.5%.
- The lowest conversion rate is of the B2B eCommerce and B2C eCommerce. They have less than 1% of the conversion. Compared to other industries, it is a VERY much low rate.
Marketing Conversion Rate Optimization Statistics
Marketing campaigns boost CONVERSIONS. Have you heard of such statements?
They are no longer a DREAM. It is 100% true. Marketing tactics help reach more consumers. And it leads to high conversion rates if you IMPRESS your consumers.
Most companies allocate a TOTAL MARKETING budget. But is it even worth it? Conversion rate stats can prove it better.
- Paid search has emerged to be the NUMBER one conversion tool. It has the highest conversion rate you’ll ever GET. Ans it 2.9% search converts from a PAID marketing campaign.
- After the paid qualified leads, say welcome to ORGANIC leads. Organic search has a CONVERSION fate of 2.8%. It is the highest conversion after the paid search.
- Not only is there BIG competition between paid and organic research, but you also get referrals. It has a high conversion rate of 2.6%.
- You can’t miss the EMAIL for small businesses just for REFERRAL traffic. It also has a reasonable conversion rate of 2.3%.
- Direct traffic is not LAGGING. You get an average website conversion rate of 2% from direct visitors.
- Social media is also a GOOD source for the average website conversion rate. It has an average lead conversion rate of 1%.

Ecommerce Conversion Rate Optimization Statistics
Some INDUSTRIES have high conversion rates. Guess why?
It is their efforts to grab the BEST opportunities when marketing their products. Plus, they offer the BEST experience to their consumers. Their BOUNCE rate is significantly low compared to the web traffic. And a SECRET to successful lead generation.
Here are the TOP conversion rates of some industries.
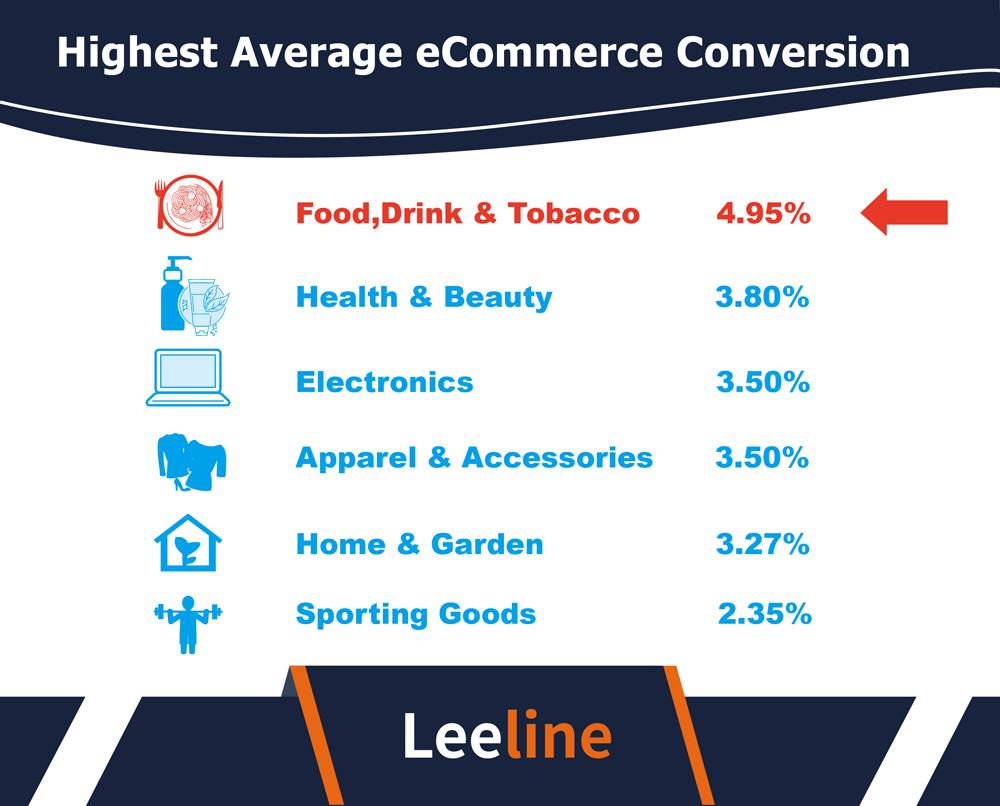
- The food, Drink, and tobacco industry has the HIGHEST conversion rate. And it is 4.95% among all the industries.
- Health and Beauty ranks second among all the industries. And their CONVERSION rates are 3.80%. The second most after the beverage industry.
- Electronics is also a TOP industry and ranks third on the LIST. It has 3.50% of the total conversion rate.
- The apparel and accessories industry comes in the Third rank. It also has the same conversion rate as electronics. 3.50% is a GOOD conversion rate, technically.
- Home and garden is no longer away from becoming the HIGHEST average conversion rate industry. It has a rate of 3.27%.
- Sporting goods comes sixth on the RANK. It has a conversion rate of 2.35%. It is also an AVERAGE conversion rate you can expect from this industry.
What’s Next
Catching the sight of the READER on your content or service is critical. And offer them something they can’t say NO to!
That is the secret to OPTIMIZED Conversion rates. Therefore, focus on the BETTER CRO for better results.
Want to know more stats like that?
Go through our WEBSITE. You’ll get authentic data.