
Have you EVER used TikTok? At least I HAVE. And 1 billion OTHER people are using this platform. According to TikTok statistics, it has a 19.2% reach in the US population. (Statista)
Can you believe in the DOMINATION of TikTok? Its Chinese version, Douyin, has over 600 MILLION users.
It does not end here. It is the 6th most used social media platform. App’s popularity is INCREASING day by day.
Want to know how?
Our Experts have COLLECTED the TikTok statistics through various reliable resources. You can GO THROUGH them. And understand the DOMINATION GRAPH.
Let’s go!
General TikTok statistics
TikTok has traveled a BIG journey. Parent COMPANY BYTEDANCE introduced this platform in 2016. And till now, it has over 3 BILLION total APP downloads.
Even the Chinese version of TikTok has 600 million DOWNLOADS. Parent company BYTEDANCE also acquired the musical.ly. And they merged it with TikTok, giving it a NEW LIFE.
Over TIME, it has been AWARDED as the most downloaded app worldwide.
So, do you want to know some more TikTok usage statistics? Here are these:
- TikTok is the MOST DOWNLOADED app worldwide. It has 35+ LANGUAGES and 150+ Markets.
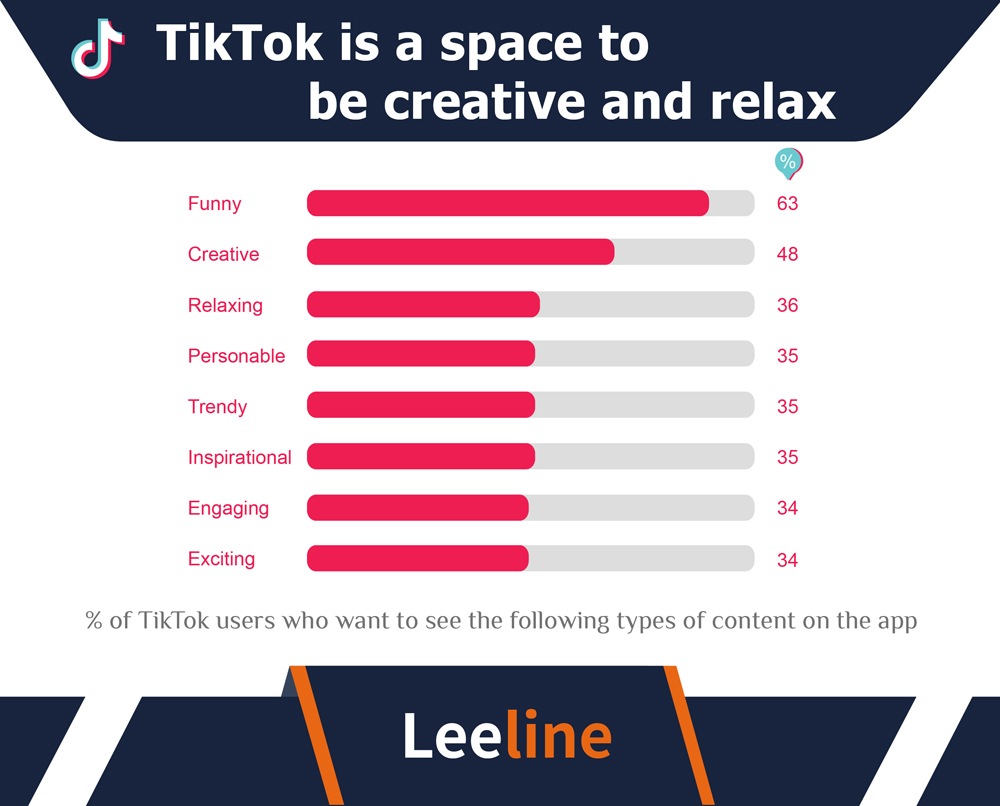
- Most users find it a CREATIVE place to enjoy and relax. 63% of the Users consider it a SOURCE of funny videos. 48% believe it is a Source of CREATIVE VIDEOS. 36% of users get RELAXED after watching the videos on TikTok. While 35% of users use it for CREATING trendy videos.
- TikTok has millions of US users. According to Reuters, 150 MILLION users belong to the US territory. It is the LARGEST TikTok audience.
- TikTok has been RANKED just after WeChat in the SOCIAL PLATFORMS. It is on the SIXTH rank. And forecasters expect it to be on the TOP social media sites sooner. (Hootesuite)
TikTok User Growth Rate Statistics
From 2016 to 2023, TikTok has achieved SUCCESS every year. It has BOOSTED the growth of the parent company. And gave a NEW WAY to people for choosing the TikTok.
Initially, it was a VERY TOUGH journey to hit 1 billion MARK in downloads. Do you know why? Because there were MANY social media platforms, such as Facebook and Instagram.
I have listed TOP TIKTOK statistics related to user growth over time.
Let’s check!
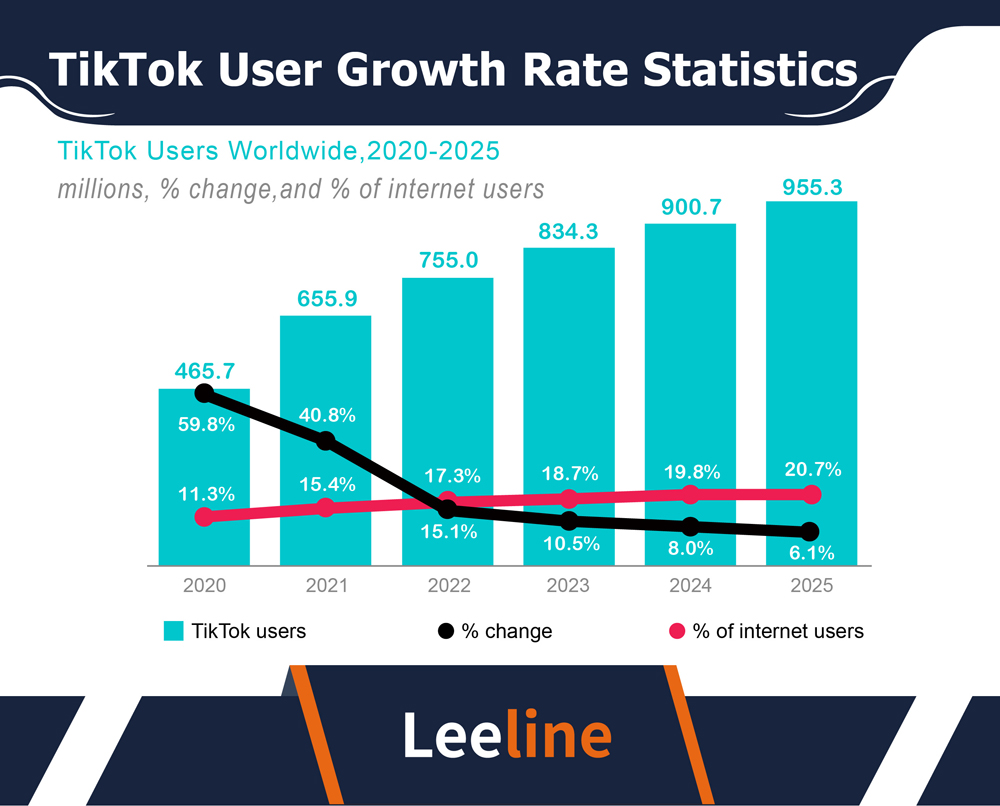
- In 2020, TikTok had 465.7 million ACTIVE users. That was a 59.8% change in the Total TikTok users compared to 2019.
- In 2021, TikTok achieved a MILESTONE of crossing 600 million users. There were 655.9 million TikTok users. It was a STRAIGHT increase of 40.8% compared to 2020.
- In 2022, TikTok was SUCCESSFUL in crossing the 700 million market. It had 755 million USERS. Compared to the previous year, the growth was 15.1%.
- In 2023, TikTok crossed the 1 BILLION mark in terms of users. That is a HUGE MILESTONE of more than 25% in progress.
- TikTok has an ANNUAL growth of 22.2%. It is more than ANY other social media platform. Users have a HIGH ENGAGEMENT on this social media site.
TikTok Demographics Statistics
TikTok has gone through DEMOGRAPHIC changes. Sometimes, middle-aged people were using it more. And now, young people use it more than others.
I have listed some significant statistics regarding Platfrom’s audience.
TikTok Users By Age
TikTok has a BIG INFLUENCE according to the age. Guess which age GROUP USES the most?
Let’s check who is the WINNER!
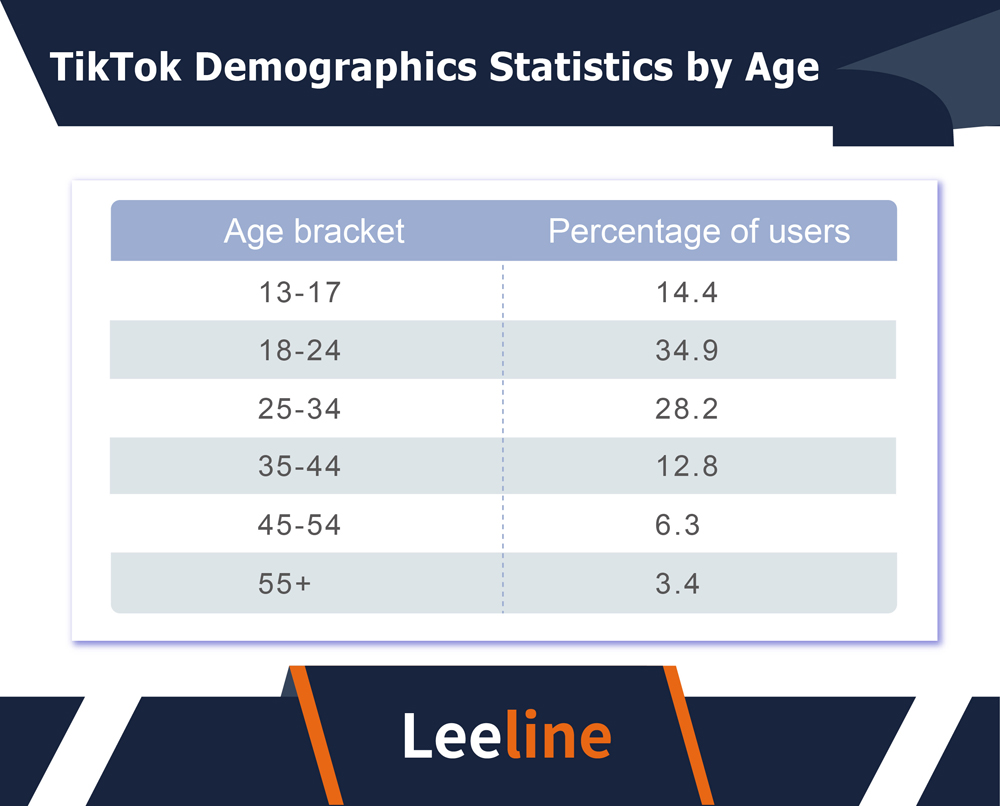
- The most monthly ACTIVE USERS belong to the 18-24 age group. It contributes to 34.9% of the monthly active users.
- 25-34 is the second most age group. It has 28.2% of the MONTHLY active users.
- The third most age group is 13-17. It has a percentage of 14.4%.
- Fourth most is the 35-44 age group for daily active users. It has 12.8% of the users.
- Only 6.3% of the DAILY ACTIVE USERS are from 45-54.
- Only 3.4% of TikTok users belong to the 55+ age.
TikTok Users By Region
TikTok was launched in 2016 only in China. Its International version was released in 2017 to get the GLOBAL approach. So, we will understand the users ACCORDING to the global expansion.
Here are some statistics according to 2022 data.
- The US has the highest platform’s audience. It has 136.2 million users, leading the chart.
- Indonesia has 99.07 million users. It is the SECOND MOST, just after the US.
- Brazil is in the THIRD RANK. It has 73.58 million users.
- Russia is on the FOURTH rank with 51.3 million users. The list goes on for the COUNTRYWIDE users.
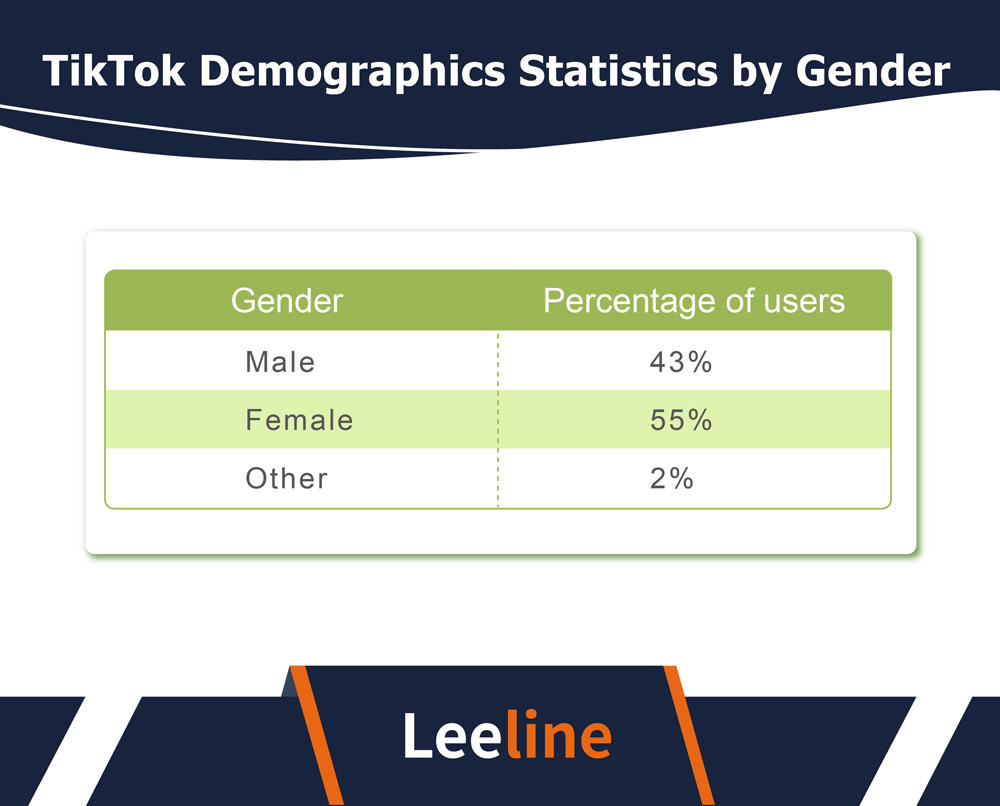
TikTok Users By Gender
According to Gender, we can check Mobile Internet users’ log. And ensure whether MALE USERS are more than FEMALE or not.
Let’s check it out.
- Females are on the TOP in the usage of the TikTok app. They create the VIDEOS. Get a million followers. And make some money. According to statistics, female users are 55%. It is the MOST of what TikTok has social media users.
- Male users of TIKTOK are 43%. It is second most just after the FEMALE USERS. These users also have MILLION followers on the TikTok. Create videos. And engage their fans.
- Only 2% of the users belong to other genders. That is the Lowest most.
TikTok User Behavior Statistics
TikTok videos are a GOOD SOURCE for engagement. Most business owners HAVE targeted global audiences through DIGITAL marketing on TikTok.
Why?
Because of the following AVERAGE USER behavior.
- The average time spent per user is 89 minutes. That is around 1.5 hours. Great! (Music Business Worldwide)
- 22% of the Millennial TikTok users WANT to know about products through TikTok. Approximately 36% of Generation Z want to do that. (Hubspot Blog research)
- 38% of USERS voted for the TikTok ads. They believe entertaining ads make them LEARN new products and things. (TikTok business statistics)
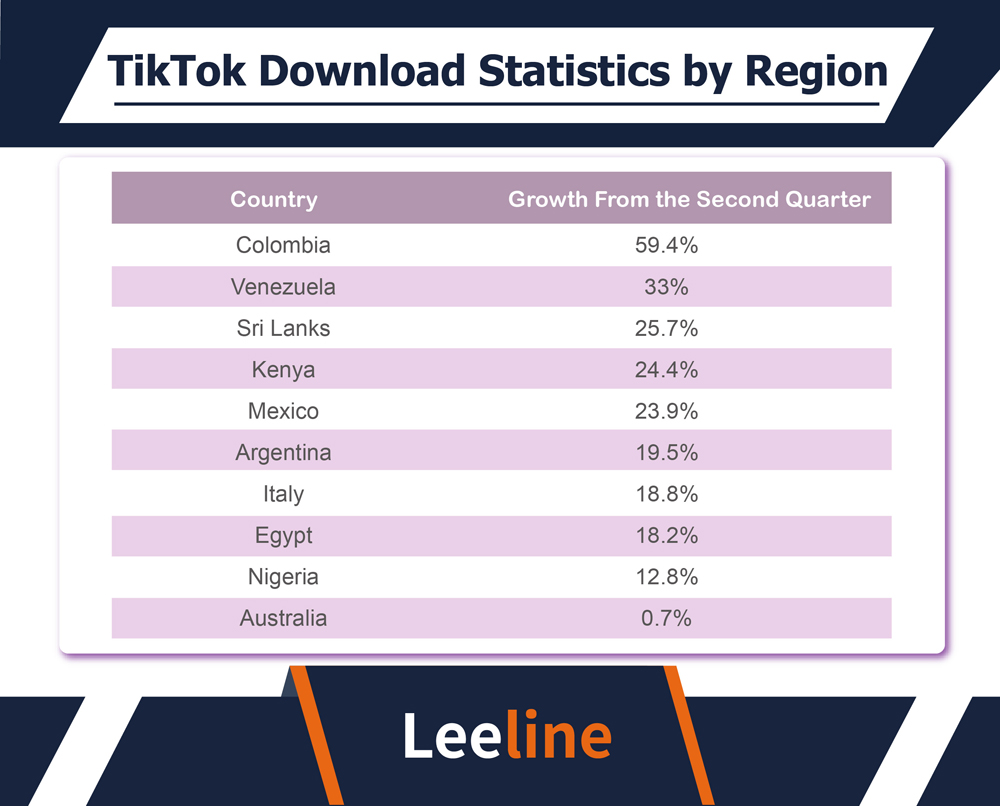
TikTok Download Statistics by Region
TikTok downloads are a DIFFERENT ASPECT from the active users. For example, TikTok has 3+ billion DOWNLOADS. And 1+ billion monthly active users.
Don’t you find it a CLEAR discrepancy?
So, you should UNDERSTAND it. Here are some TikTok stats regarding the growth in the second quarter of 2022 in each country.
- Columbia is on the TOP for the most growth in 2022. It noticed an Increase of 59.4% in users.
- Venezuela comes just after the Coumboa. So, it is on the SECOND rank on our list. It noticed a GROWTH of 33%.
- Sri Lanka is third on the List for the TikTok growth. The growth in 2022 was 25.7%. That is HUGE and primarily due to the High TikTok penetration rate in each country.
- Kenya is just after Sri Lanka. Guess the growth rate? It is 24.4% of the USERS increase.
- Mexico comes on the FIFTH rank with a growth of 23.9%. It is the COUNTRY with 20% plus growth.
- Argentina comes after Mexico. It noticed a GROWTH of 19.5%. That is good, too.
- Italy is SEVENTH on the list with a GROWTH of 18.8%. Egypt is JUST less than one percent behind. It has 18.2% growth.
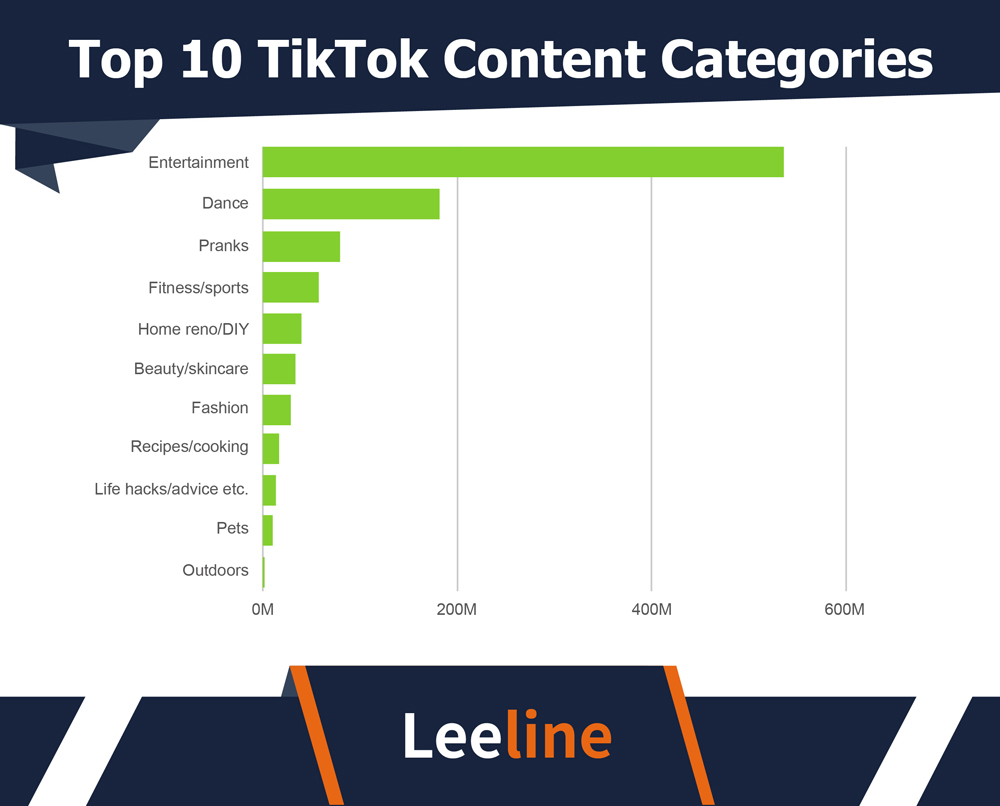
TikTok Content Statistics
I have a SIMPLE QUESTION. Why do we use TikTok? What is the ULTIMATE goal?
There can be MANY REASONS. An average TikTok user wants FUN and entertainment. On the OTHER HAND, companies have a TARGET audience. They target young ADULTS and users on this social media app.
Different TikTok Statistics highlight which TikTok content CATEGORIES are on top.
- The Entertainment Industry is on the TOP for the number of views. The entertainment industry is LEADING the chart. It has 535 billion views. It is more than 50% of the dance category.
- Dance is on the SECOND rank. It has 181 billion views. It is also MORE than 50% more of the third-rank category.
- Pranks come on the THIRD NUMBER. They have 79 billion views.
- The fitness and sports category is FOURTH on the list. It has 57 billion views.
- The Home reno/DIY category is FIFTH on the list. It has 39 billion views.
- The Beauty/skincare category is SIXTH on the list. It has 33 billion views.
- The Fashion category is SEVENTH on the list. It has 27 billion views.
- The recipe/cooking is EIGHTH on the list. It has 18 billion views.
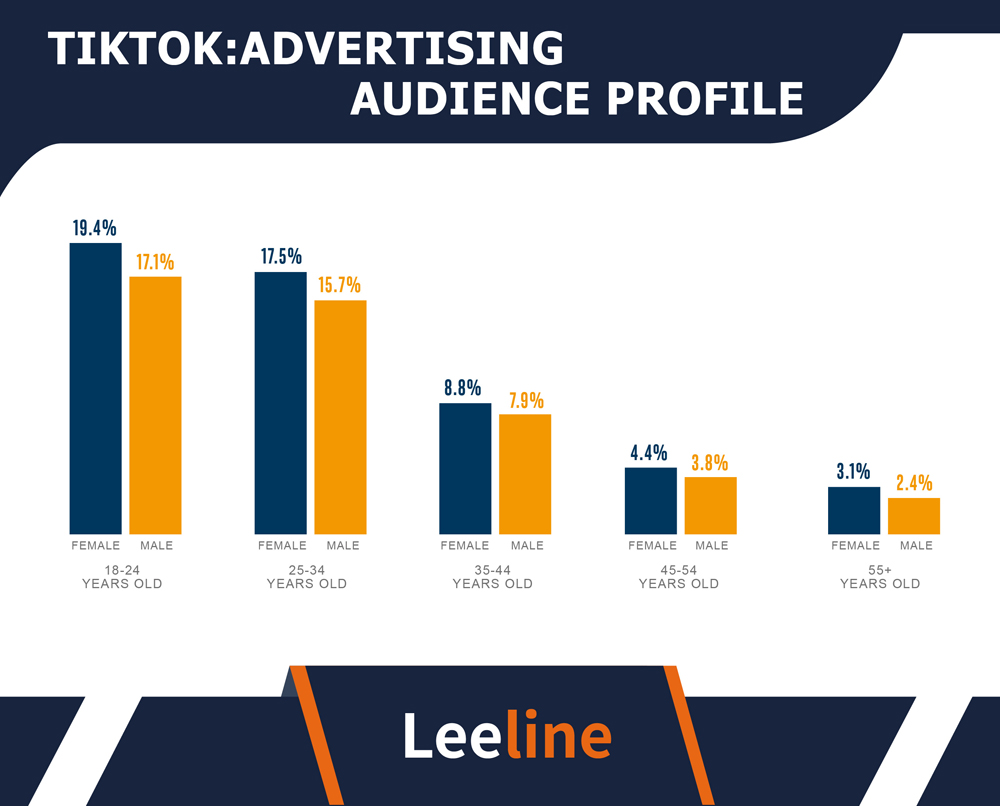
TikTok Marketing and Advertising Statistics
Are you a Business owner? That would be GREAT if you knew about TikTok. It has helped MANY businesses grow. Chanel, Nike, and Many beauty brands use TIKTOK to promote their videos.
And it brings up POSITIVE results with a high conversion rate. The secret of business ADVERTISING lies in the engaging video content.
I have listed SOME MAJOR business statistics on TikTok.
- The highest target for all the BRANDS is the females. In the same age group of 18-24, female audience is 19.4%. That means BUSINESSES are targeting females more than males. Male target audience is 17.1%.
- The results are the same for 25-34 year old people. The female target AUDIENCE is 17.5%. Compared to it, the male audience is 15.7%.
- At the age of 35-44, you can find similar statistics. The female target AUDIENCE is 8.8%. Compared to it, the male audience is 7.9%.
- At the age of 45-54, you can find similar statistics. The female target AUDIENCE is 4.4%. Compared to it, the male audience is 3.8%.
- At the age of 55+, you can find similar statistics. The female target AUDIENCE is 3.1%. Compared to it, the male audience is 2.4%.
TikTok Revenue Statistics
TikTok has almost a BILLION monthly active users. Even the Chinese version of TikTok has over a million USERS. Since TikTok is a POPULAR app, it generates millions of dollars.
Advertising campaigns and in-app purchases make most of its revenue.
Can you believe in that? Let me get you SOME statistics regarding it.
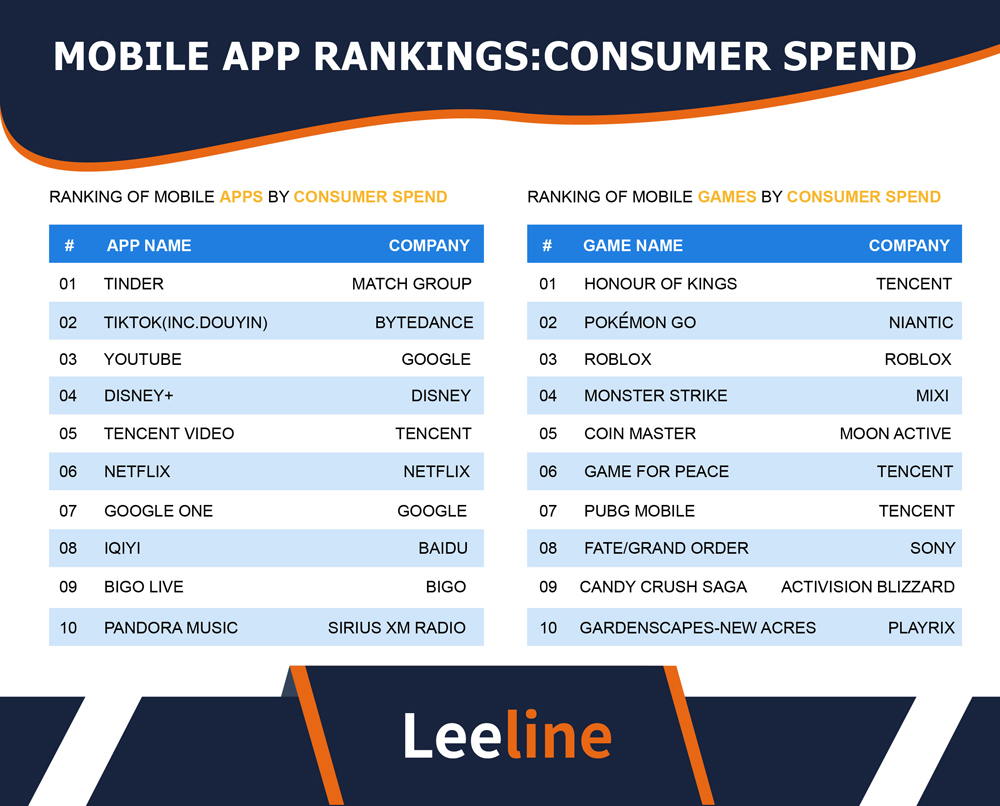
- TikTok generated 497.69 million USD from in-app purchases. It is just the EARNING of the first quarter of 2023. TikTok brand value is 443.48 billion USD. (Statista)
- TikTok comes on the SECOND number based on user spend. Tinder has the FIRST RANK globally. After that, TikTok made the PLACE among all the apps worldwide.
- TikTok revenue is CONSTANTLY increasing over the years. In 2017, TikTok generated 63 million USD.
- In 2018, there was an increase of 150% in the REVENUE. And TikTok made over 150 MILLION USD in revenue.
- It did not stop there. Instead, in 2019, there was a HUGE increase in revenue, about 125%. TikTok noticed an increase to 350 Million USD in revenue.
- In 2020, TikTok got a SUDDEN SURGE in revenue and number of users. Its revenue reached 2.6 billion USD. That is roughly a 750% increase.
- In 2021, the data got DOUBLED. The net revenue was 4.67 BILLION USD.
- In 2022, it reached 9.40 BILLION USD MARK.
Best Time Post On TikTok
The average engagement rate on TikTok is VERY HIGH. But you need to boost engagement. And how can you do that?
It is possible with the RIGHT time for posting. For example, if you post at 9 a.m. EST, it generates more engagement.
There are more statistics to know regarding the BEST time. Here are these:
- The best time to POST is 9 a.m. EST on Tuesdays. 12 a.m. EST on Thursdays. And 5 a.m. EST on Friday.
- For TikTok live, you must be LIVE from Monday to Friday during specific times. 9 a.m. to 11 a.m. EST is the MOST FAVORABLE time. Even after 7 p.m. EST is also a GOOD choice. You can generate maximum engagement.
Most Popular TikTok Creators
TikTok not only has the VIEWERS. But also a LARGE number of creators are there. They might age differently. Mostly, YOUNG GENERATIONS are more interested in creating videos. Posting them on TikTok. And get the APPRECIATION.
Here is the distribution of age GROUP based on the creators.
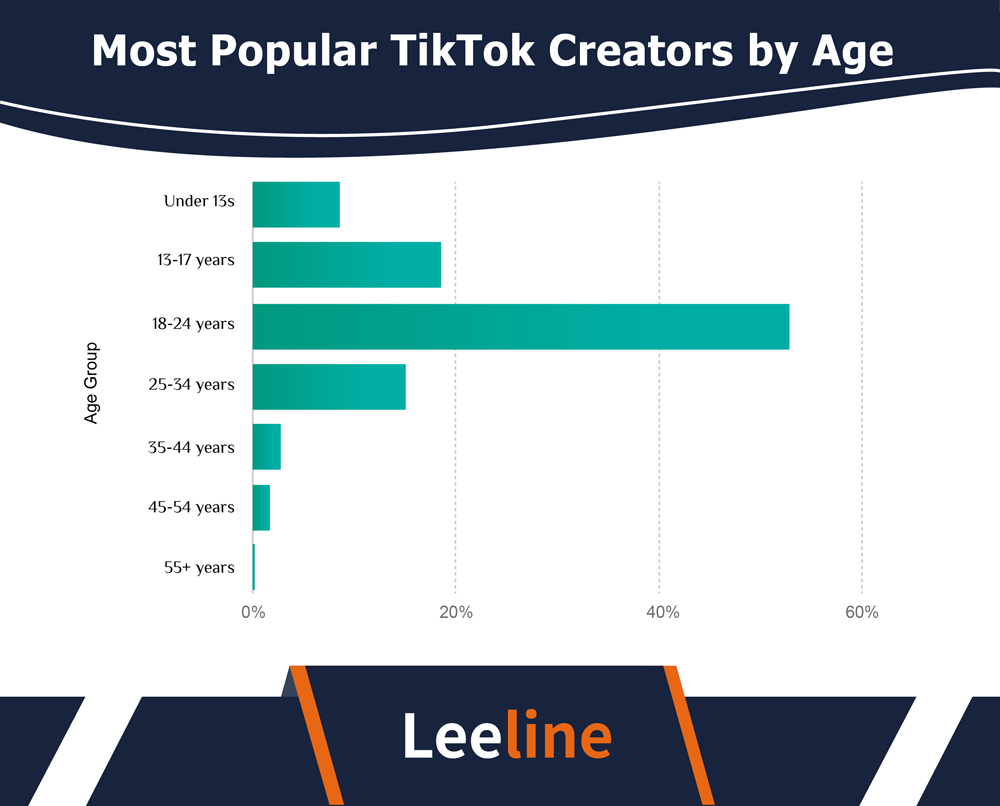
- The highest PERCENTAGE of creators belongs to 18-24-year-olds. That is 52.83% of the TOTAL.
- The second number goes to the age of 13-17 years. There are a LOT of creators in this age group as well. Around 18.67% of the CREATORS belong to it.
- The third rank is just BEHIND the second one. There is only a 3% difference. The age group is 25-34, creating the THIRD-MOST videos. It has a SHARE of 15.03%.
- Creators under the age of 13 years make up the FOURTH place on our list. They have a SHARE of 8.7%, which is still a HUGE.
- Age 35+ are the CREATORS with the minor share. For example, 35-44-year-olds have just a SHARE of a mere 2.75%.
- Age 45-54 have a SHARE of just 1.65%. And 55+ year old people have just 0.36%. That is not a HUGE number.
What’s Next
TikTok has emerged as a BIG SOCIAL media site in the past two years. The sudden adoption is due to HIGH engagement. And the increasing use of smartphones. It helps PEOPLE RELAX better. And businesses make more MONEY.
Want to know more stats like that? Visit our website. You’ll get new and RELIABLE statistics.