
I have used many SOCIAL media PLATFORMS. Out of 24 hours, I spend 5-6 hours daily.
It is not all about me. Instead, millions of INTERNET USERS do so. They spend most of their TIME scrolling YOUTUBE SHORTS. Or instagram reels.
According to Statista, there are 4.8 billion USERS of the Social media platform. Just imagine. The global POPULATION is 8 billion. And around 5 billion use SOCIAL MEDIA PLATFORMS.
Isn’t it astonishing about the SOCIAL MEDIA STATISTICS?
Want to know more exciting data about social media users worldwide? Read this GUIDE. You’ll get in-depth stats on GLOBAL USERS of social media platforms.

Key Social Media Statistics
Facebook users. Instagram users. TikTok users. If you collectively count THEM, they even exceed the TOTAL population.
But that is not the case here. Instead, one internet USER has installed multiple apps. For example, I have installed YouTube, Facebook, and Twitter.
Some of you might have other apps like Instagram or TikTok. The purpose of saying so is the WIDESPREAD use of
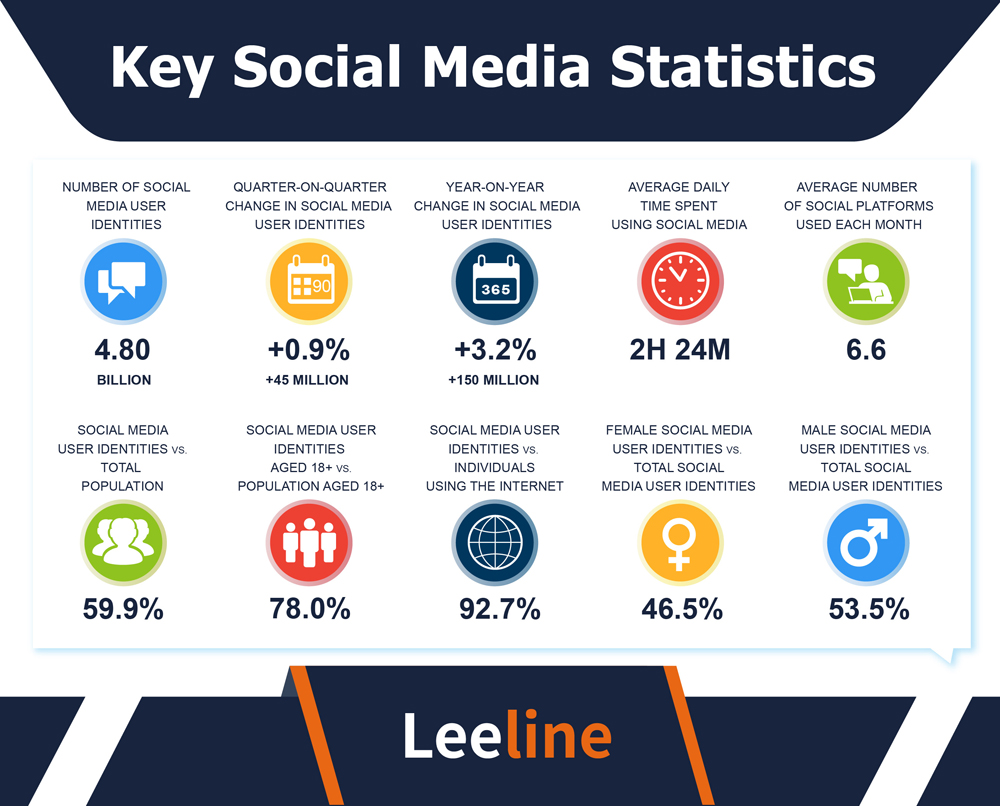
Datareportal has SUBMITTED the detailed data about the key social media statistics. You can get a list of them here.
- The total count of social media users is 4.8 billion. It comprises all the INTERNET USERS as well. Facebook remains at the TOP for the most number of users. It has 2.9 BILLION users compared to other platforms.
- 90-day change in the SOCIAL MEDIA IN 2023 is the increase of the users. Forty-five million users have INCREASED on the social selling platforms. That is a 0.9% growth in total users.
- Three hundred sixty-five days of change has been SIGNIFICANT. Around 150 million users have INCREASED in the previous year. It is 3.2% of the TOTAL GROWTH.
- The average daily time spent is above 2 hours. Some data reckon around 2 hours and 24 minutes spent by each internet user on the SOCIAL PLATFORM.
- An average user uses more than six social platforms each month.
- Compared to the TOTAL POPULATION, social media has 59.9% of the users.
- 78% of the 18+ adults use the SOCIAL MEDIA. It is the RATIO of the total population of 18+ years of age. In contrast, 92.7% of the INTERNET browsers use social networks.
- Female users are less than MALE users on social media. There are around 46.5% of the FEMALE users. On the other hand, male users, around 53.5% of the TOTAL users.
Social Media Usage Statistics
Social media usage has been a PROMINENT topic. The discussion is all about the FEMALE and male users.
Guess who is on the top? On average, male users are on the TOP. However, there is a different distribution of the number of users per social platform. For instance, Facebook users are female more than MALES.
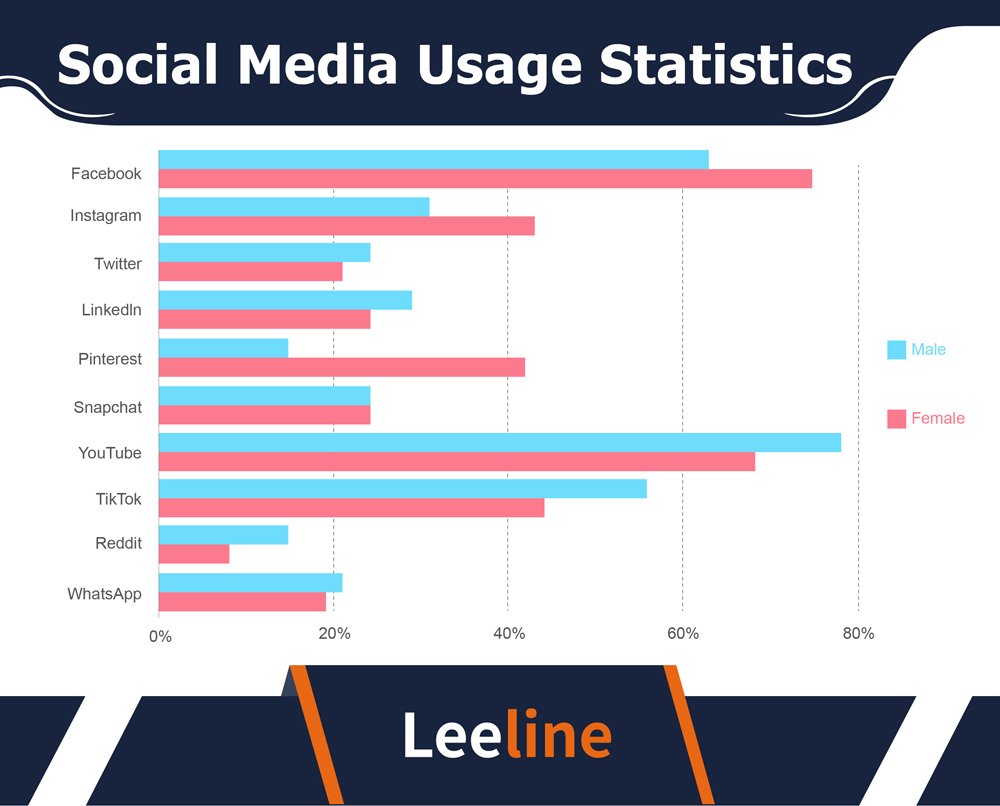
Let’s talk about the DATA from Statista.
- Facebook has more females than the male. 75% of users are females. And 63% are males.
- Instagram also has the domination of females. 43% of users are females. And 31% are males.
- The stats get reversed on the Twitter users. 21% of users are females. And 24% are males.
- LinkedIn has more usage from males. 24% of users are females. And 29% are males.
- Pinterest has a huge gap between male and female usage. 42% of users are females. And 15% are males.
- Snapchat has the same usage from both genders. It is 24% of the BOTH males and females.
- YouTube has more domination of male users. There are around 78% of the male users. And 68% of the females.
- TikTok also has the same data. There are 56% of the males on TikTok. And 44% of the females.
Social Media Platforms Statistics
Look. The number of active users differs from the number of accounts or downloads. On Facebook, one person can create as many accounts as he wants. There are no restrictions.
But the ACTIVE users are less. Because they are available REAL-TIME on the social media platform. When checking out a SOCIAL MEDIA site, you must know active users. Not the NUMBER OF APP DOWNLOADS or accounts.
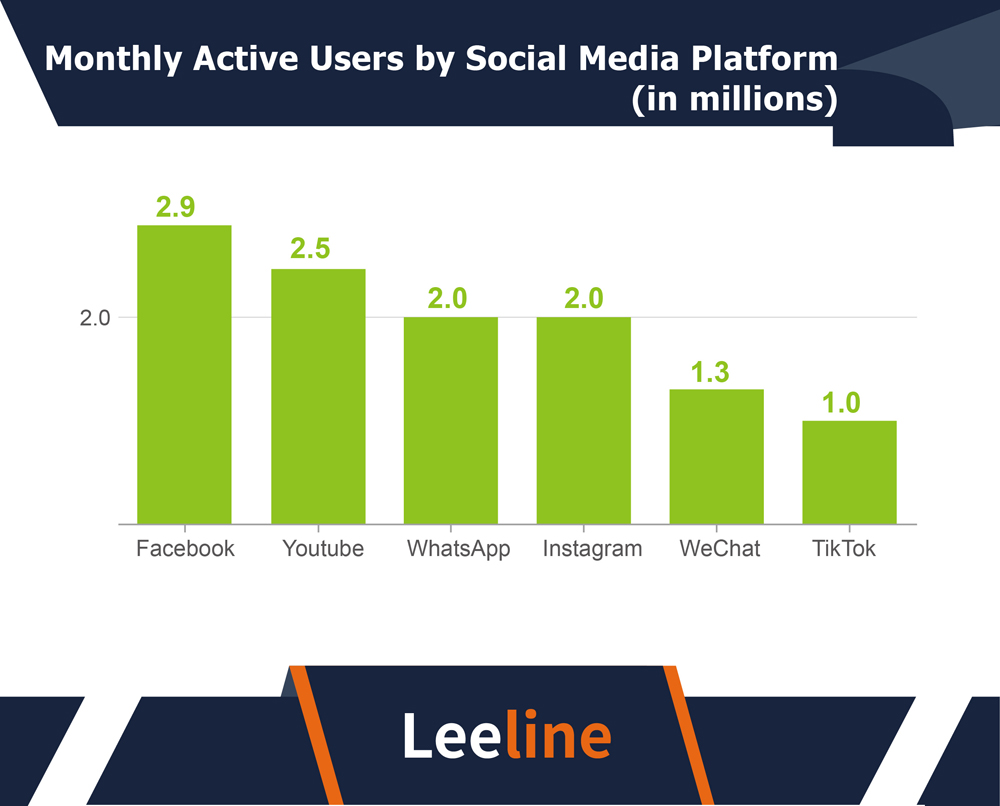
Here is the brief data of users on Social media.
- Facebook is the NUMBER ONE in terms of users. Its active users are 2.9 billion. It is more than half of the TOTAL SOCIAL media users.
- YouTube is second on the RANK for internet user counts. 2.5 billion users ACTIVELY USE YouTube each month. They watch videos and scroll shorts to get entertained.
- WhatsApp is THIRD in the rank with 2 billion users. They actively use this platform.
- Under the META PLATFORM, there is Instagram. It has 2 billion users, just like WhatsApp.
- Wechat is FIFTH on the RANK as per active user accounts. It has 1.3 billion users. That is a VERY high count.
- TikTok comes after WeChat. The total number of users is 1 billion active each month.
Social Media Advertising Statistics
Social media is the BEST ADVERTISING channel. Do you know why? Because the AVERAGE click-through rate is QUITE high.
Influencer marketing brings easy access to social media users. Marketing on social media statistics show a RAPID increase over the years.
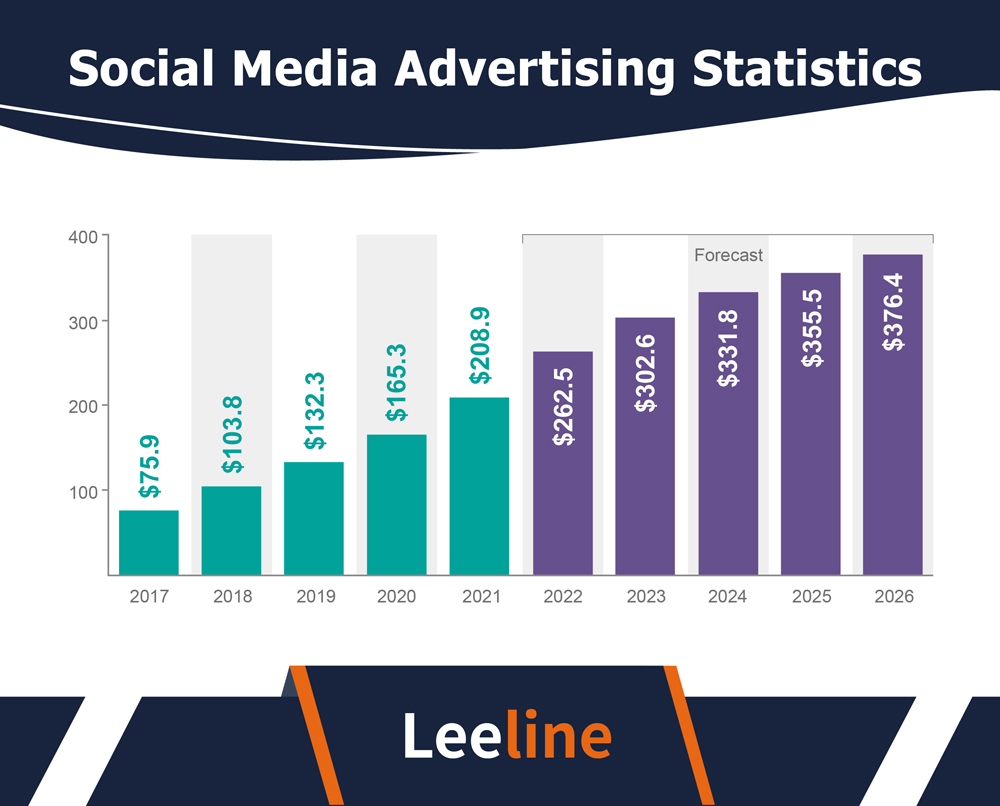
Want to know some social media advertising statistics? Get it here.
- In 2017, social media marketing spending per user was 75.9 USD.
- In 2018, it showed an increase of more than 30%. Social media marketing spending reached 103.8 USD.
- In 2019, the progress was the same as before. Social media ad spend was 132.3 USD. That is roughly 30% of the previous year.
- In 2020, the COVID-19 PERIOD was there. But, it did not reduce the social media advertising market revenue. Per user, social media ad spending reached 165.3 USD.
- In 2021, it noticed a big progress. The revenue per user reached 208.9 USD. It is again 30%. That means social MEDIA marketing has increased steadily over the YEARS.
- In 2022, social media marketing revenue reached 262.5 USD per user. In 2023, it crossed the 300 USD figure, making 302.6 USD.
- As per the increase, the forecaster expects it to reach 376.4 USD by 2026.
Social Media Influencer Statistics
Influencer marketing has been TOP on social media channels. Get a MILLION FOLLOWER TikToker. Advertise your PRODUCT. And get exponential sales.
It happens due to DETAILED videos that engage more users. And speed up the selling process.
Guess which generation of people are on the TOP? Let’s know by exploring social media presence.
- 69% of the US social media users believe the Influence of SOCIAL MEDIA MARKETERS. They think it affects their purchase design.
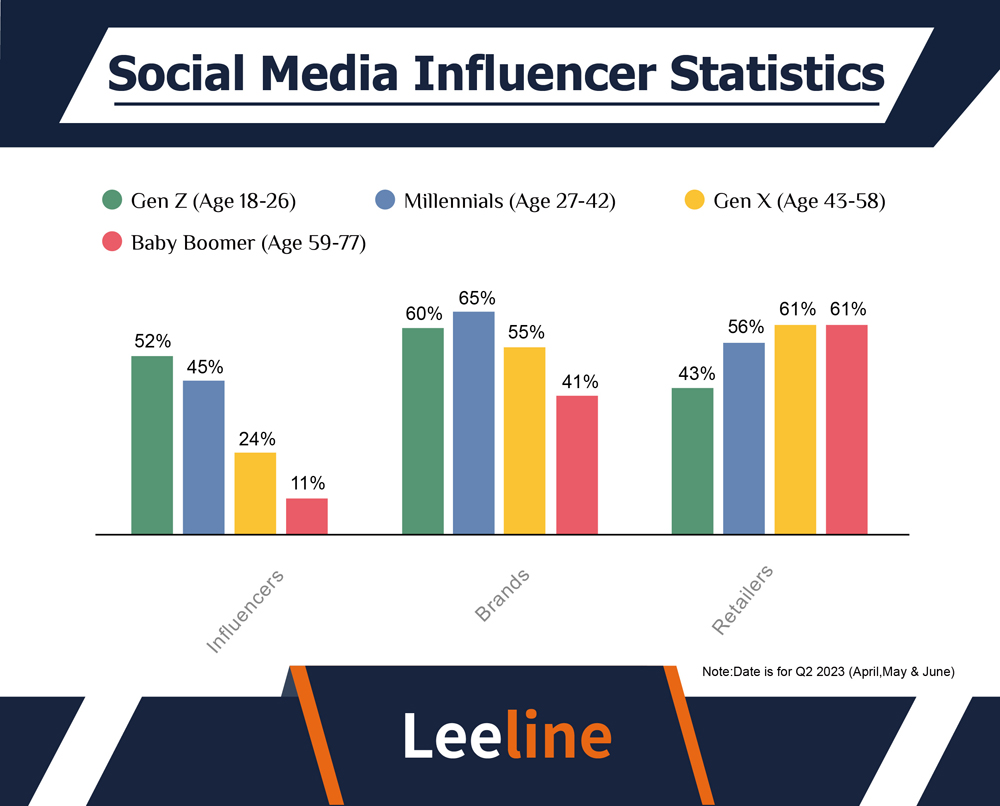
- In Gen Z, the influence of BRAND accounts is greater. It is around 60%. In contrast, influencers account for 52% of Gen Z people. The lowest is the RETAILERS account with 42%.
- In Millennials, you can expect a DIFFERENT trend. 65% of the SOCIAL MEDIA USERS worldwide voted for Brand accounts. 56% went to retailers. And 45% went for the influencers.
- In Gen X, the maximum influence is of the retailers. 61% of the RESPONDENTS voted for it. 55% favored the social media presence of BRANDS. And 24% went to the Influencers.
- Baby boomers also believe more in the RETAILER ACCOUNTS. 61% of the people do so. 41% voted for the branded accounts. And only 11% voted for influencer marketing efforts.
Social Media and Mental Health Statistics
Social media has an IMPACT on social media users. To be HONEST, it is TOXIC for an average person.
And spending hours on such sites can cause depression. And other MENTAL HEALTH problems. Even different surveys have indicated it.
There are statistics on the DETRIMENTAL IMPACT OF social media on active users.
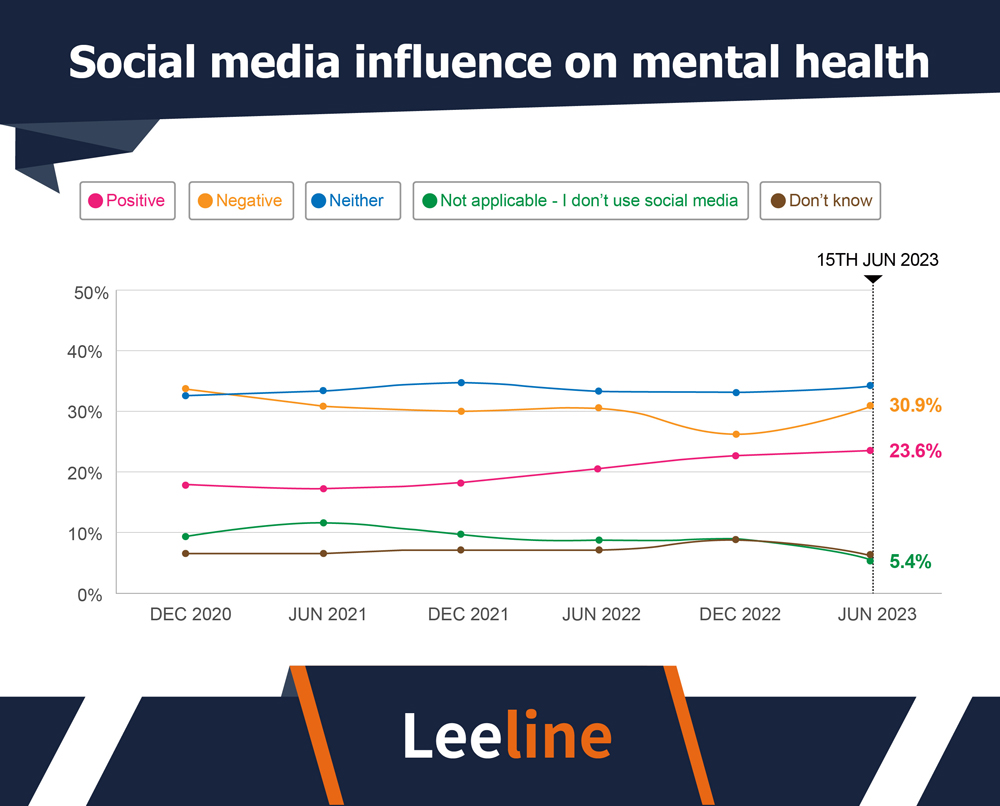
- 30.9% of the ACTIVE USERS on social media have claimed a negative impact. It affects their LIVES negatively. And causes them depression.
- 23.8% of the active users have VOTED for the positive impacts of social media.
- 34% of the users don’t have any DECISION. They talk about no positive or negative influence of social media.
Global Social Media Growth Statistics
There are tons of SOCIAL MEDIA APPS. Facebook. Instagram. TikTok. Youtube. All of them have made their WAY into almost all the countries through the internet.
And when we measure the TOTAL SOCIAL MEDIA PRESENCE of users, we can not ignore the global population. Around 90% of TOTAL internet users use social media.
To evaluate which area has the MOST social media users, I have listed some data.
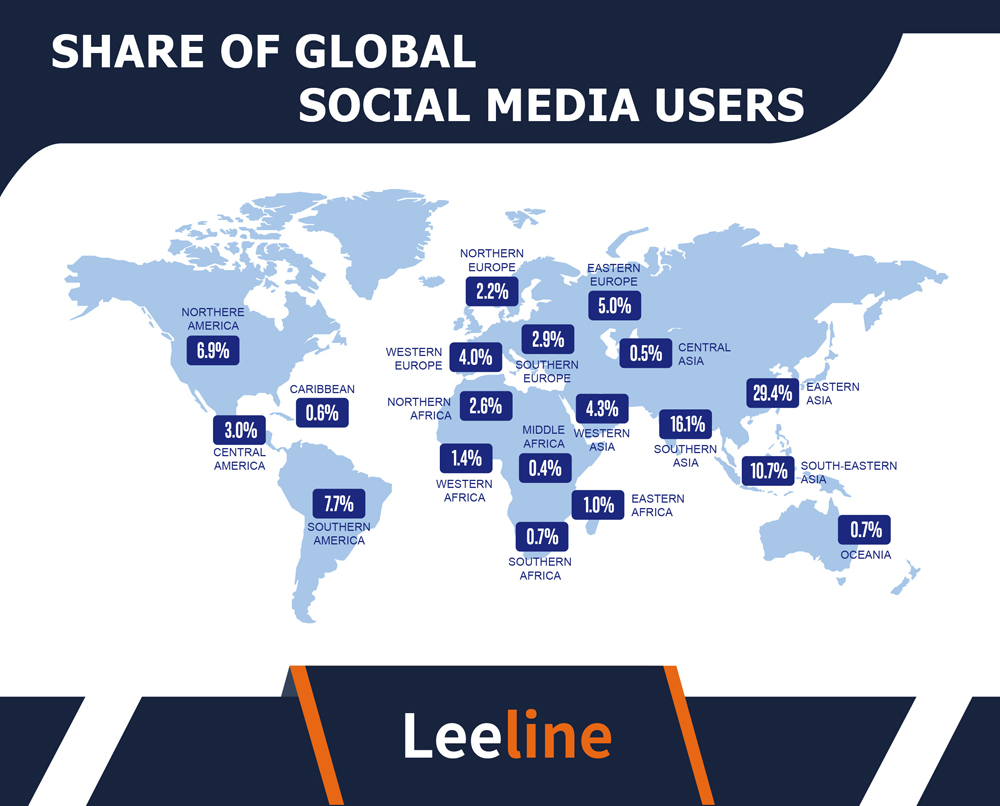
- 56% of the TOTAL social media people are from the ASIA. Eastern Asia has the MOST users, with 29.4% monthly active users. After that, Southern Asia has 16.1% of the TOTAL users. And South-Eastern Asia users are 10.7%. Roughly more than 2.5 billion USERS of social media networks belong to ASIA.
- 44% of the online shoppers on the SOCIAL MEDIA platforms belong to other countries.
- In America, Southern America has 7.7% of the users on social platforms. Northern America has 6.9% of the users. And Central America has 3% of the users.
- Eastern Europe has 5% of the users. Western Europe has 4%. Northern Europe has 2.2% of the users. And Southern Europe has 2.9%.
- Africa has 6.1% of the TOTAL SOCIAL media users available.
Average Time Spent on Social Media
Different internet users spend different times on social media platforms. Some might spend 60 minutes, while others might spend 120 minutes.
But the total time spent on Social media platforms is different. For example, TikTok is on the TOP for time spent by daily active users.
Here are some statistics.
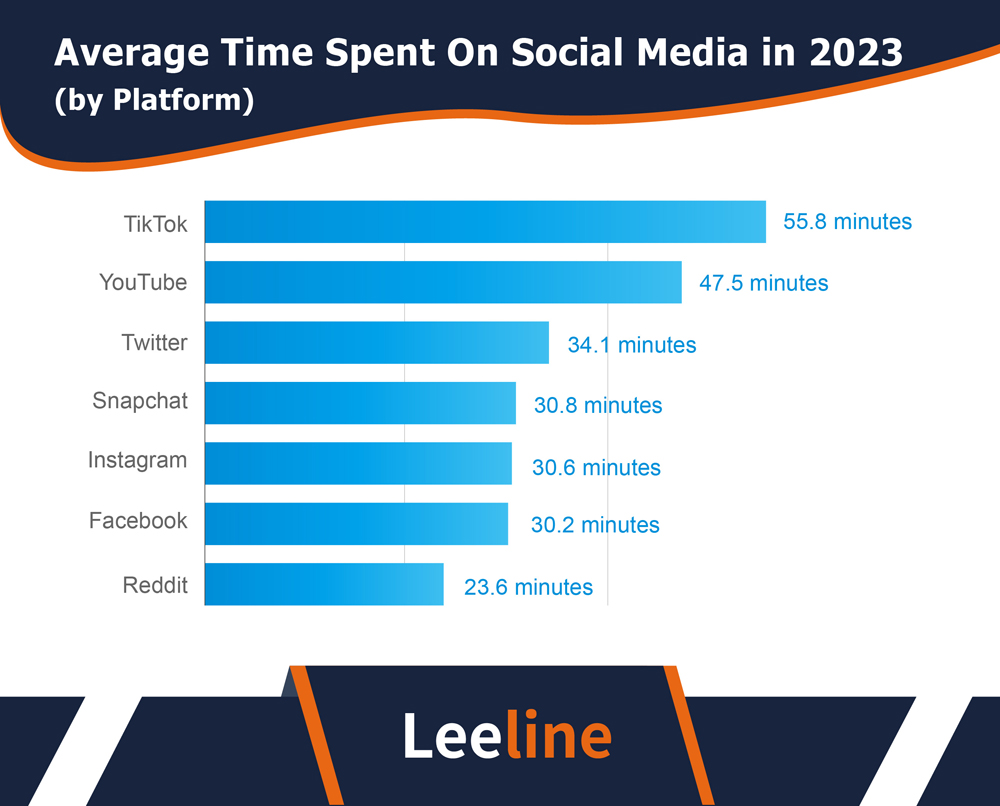
- Social users SPEND 55.8 minutes on an AVERAGE on TikTok. It is the MOST BY internet users on the social media platform.
- The second most spent time is 47.5 minutes by monthly active users. It is on YouTube.
- Twitter users spend 34.1 minutes. In contrast, Snapchat users spend 30.8 minutes on this POPULAR SOCIAL MEDIA PLATFORM.
- Instagram users spend 30.6 minutes on this social platform.
What’s Next
60 out of 100 internet users use SOCIAL MEDIA. Don’t you think that is a HUGE opportunity to use social media advertising?
Hundreds of businesses set up their social media marketing strategy. And make up MOST of their businesses.
Want to know more statistics like that? Go through our WEBSITE. You’ll get the LATEST data on different business aspects.