Have you ever wondered why FACEBOOK is the social media industry leader?
Let me disclose some facts.
- The average engagement rate is high.
- Facebook stories or posts are pretty engaging.
- It comes with FACEBOOK messenger. A chatting app further enhances the customer experience.
- Facebook app for mobile phones.
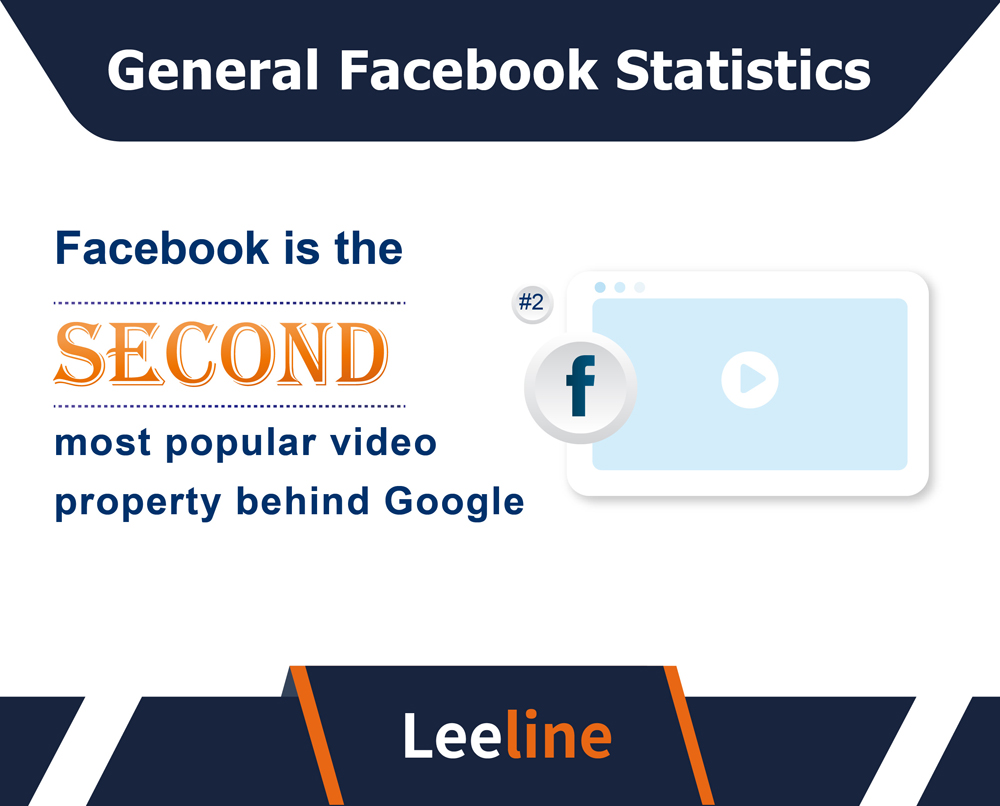
All these factors lead to a high average engagement rate. And thus, FACEBOOK is so popular, having 2.91 billion users. (Statista)
Do you want to know some exciting facts about Facebook?
I have made a complete list of the latest Facebook statistics. You’ll know Facebook’s potential advertising reach, adoption, and engagement through videos.
Ready to explore?
Let’s talk.
General Facebook Statistics
Who does not know about the FACEBOOK? If you are on the internet, it is impossible if you do not know about Facebook. Or haven’t listened to it.
Let me be clear about its prominence.
Facebook is TECHNICALLY the number one in the WORLD. All other social media platforms are lagging in USERS and revenue. Active FACEBOOK users are in the billions, not millions.
Want to create your account? Wait. Here are more FACEBOOK usage statistics.
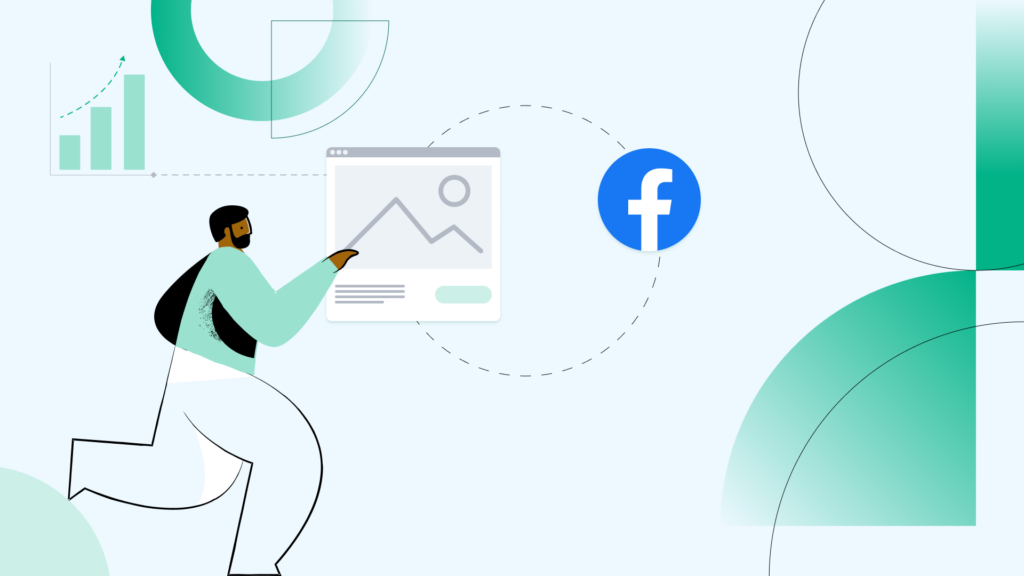
- Facebook is on the SECOND RANK after Google. What I am TALKING about is the overall ranking, not the SOCIAL media ranking. In social media platforms, it is the most popular platform.
- Guess the monthly ACTIVE users of Facebook? Just make a rough estimate, and you’ll still be wrong. It is because Facebook has a whopping 2.91 billion MONTHLY active users. It is more than 30% of the POPULATION of world. Just think about such a HIGH dominance in the number of monthly active users.
- Similarly, guess the daily active users. 1.93 Billion, it is a much bigger social media platform you ever think about.
- Among the MONTHLY or daily active users, primary FACEBOOK demographics share data. According to the data, young age is DOMINATING. Age 18-34 has a 71% share in the TOTAL traffic of the social media platform.
- Facebook ADVERTISING is a market leader, too. Facebook ads statistics show FACEBOOK has 23.8% of the share of the advertising market. That totally means 23.8% of the Advertising is done on the FACEBOOK.
- Business pages have TAKEN a prominent place. A Facebook page offers EASE to promote the business. And therefore, around 45 million ACTIVE Pages are there on the FACEBOOK.
- 67% of the ADULT population in the US is a fan of FACEBOOK. They use this social media platform on their DESKTOP or mobile devices.
Facebook User Statistics
Facebook started in the US but reached globally.
However, some years have so UNFORNATUTE noticing a decrease. Here is some data about Facebook adoption among users.
- Seven hundred million PLUS users use the FACEBOOK events. The most common event types are emergencies or any other problem.
- 2.91 billion FACEBOOK users are from different countries. 10% plus share comes from INDIA. Overall, Asia contributes the MOST in terms of users.
- 81% of the SMARTPHONES have a Facebook app. It helps them connect with other people and use FACEBOOK.
Facebook Monthly Active Users
Facebook has BILLION monthly active users. They engage with the PHOTO POSTS or watch status posts. Here is the data.
There are 2.91 billion MONTHLY active users. These are rising over the YEARS. And it is going to cross 3 billion MARK sooner or later.
They open FACEBOOK either daily or weekly.
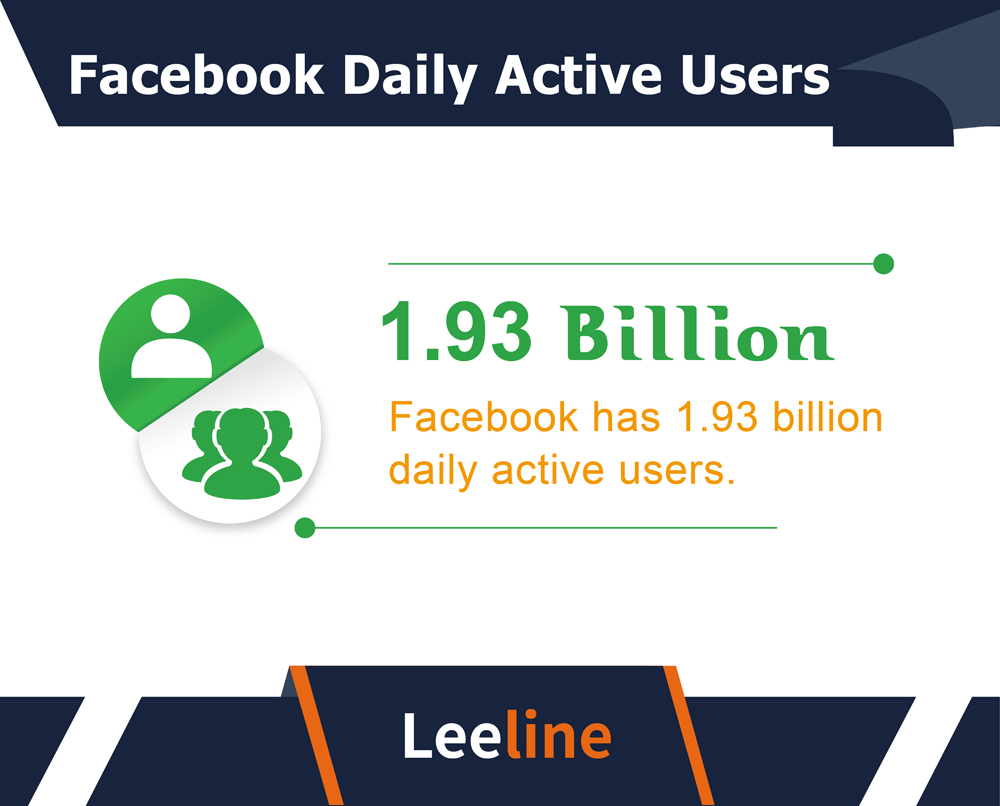
Facebook Daily Active Users
Facebook’s daily active users OPEN the FACEBOOK on a daily basis. No exceptions here at all. There are around 1.93 billion DAILY active users.
They like the FACEBOOK videos. Run their Facebook pages. And engage with FACEBOOK FRIENDS through status posts. The spending time can be in hours or minutes depending on them.
Facebook Usage Statistics
Facebook has been one of the TOP SOCIAL media platforms for usage. Every single person spends at least 30 minutes on this site. That means billions of hours are spent daily only on the FACEBOOK. It is an unbelievable fact!
Not only is Facebook engagement high, but Facebook users also speak the story. For example, FACEBOOK has almost 3 billion monthly active users. That is an astonishing fact.
Let’s know different usage FACEBOOK statistics!
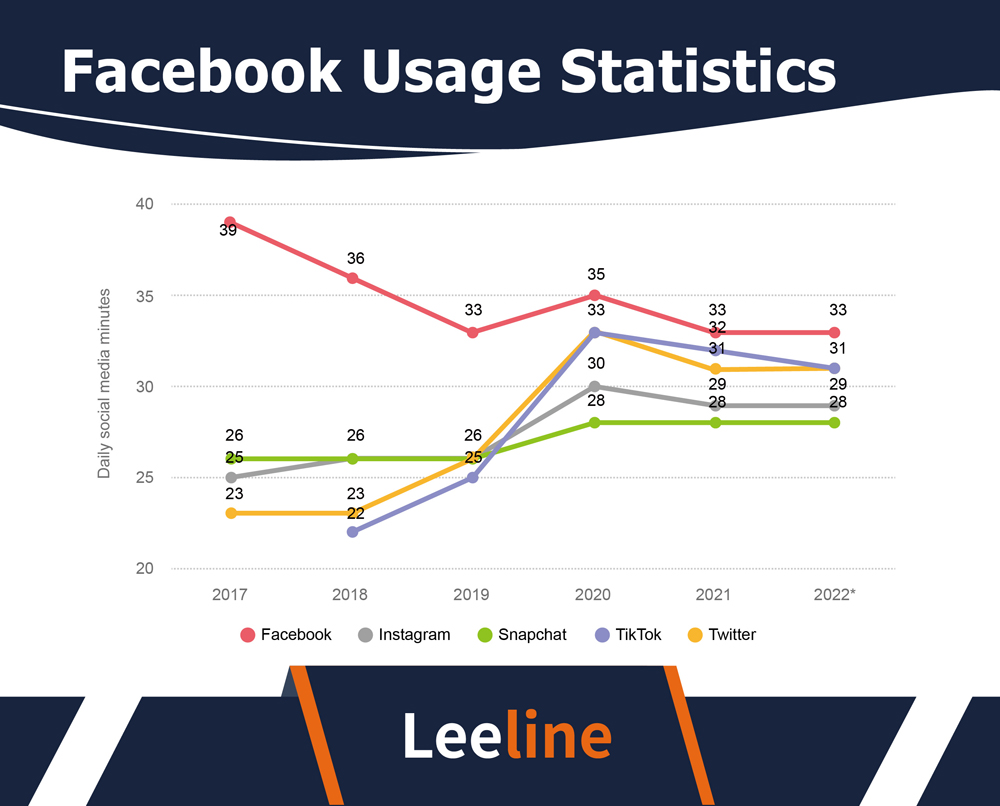
- Among the US adults, this social media giant is leading the chart. From 2017 to 2023, FACEBOOK has been top among the social networks.
- The average time spent on Facebook was 39 minutes per user in 2017. After that, it comes the rank of the SNAPCHAT.
- In 2018, this chart showed a slight decline. Every US adult used to spend 36 minutes on Facebook.
- In 2019, it reached 33 minutes of usage per user.
- In 2020, it showed a slight increase. There were 35 minutes spent per user.
- In 2022, you can get 33 minutes per US user.
- In 2023, the stats for the spending time per user are almost the same. It is 33 minutes. (Statista)
Facebook Audience Statistics
Facebook audience ACTIVITY is very important. It shows how an AVERAGE user reacts to FACEBOOK marketing ads and other things.
Do you want to know the data? Here it is.
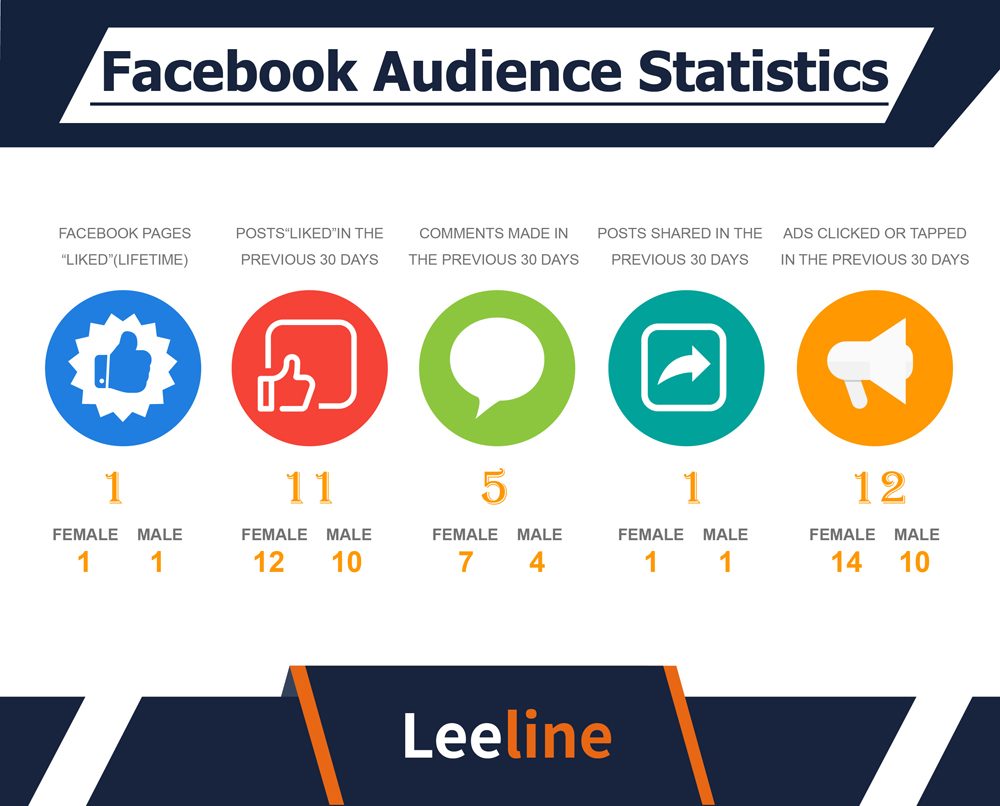
- An 18+ likes at least one FACEBOOK page in his TOTAL DURATION on FACEBOOK.
- He makes at least 11 likes in the PAST 30 days. It is about the number of posts liked.
- At least five comments are MADE on Facebook in the 30-day duration.
- There has been AT LEAST one share of the page in the past 30 days.
- One user at least clicked 12 FACEBOOK marketing ads in the past 30 days.
Facebook Video Statistics
Do you love Facebook videos? To be honest, I usually thought FACEBOOK stories to be part of the videos. But in actuality, they are QUITE different. However, there are different types of FACEBOOK posts. Some are image posts, while others can be video posts.
No matter what type of post, you must know the different statistical data.
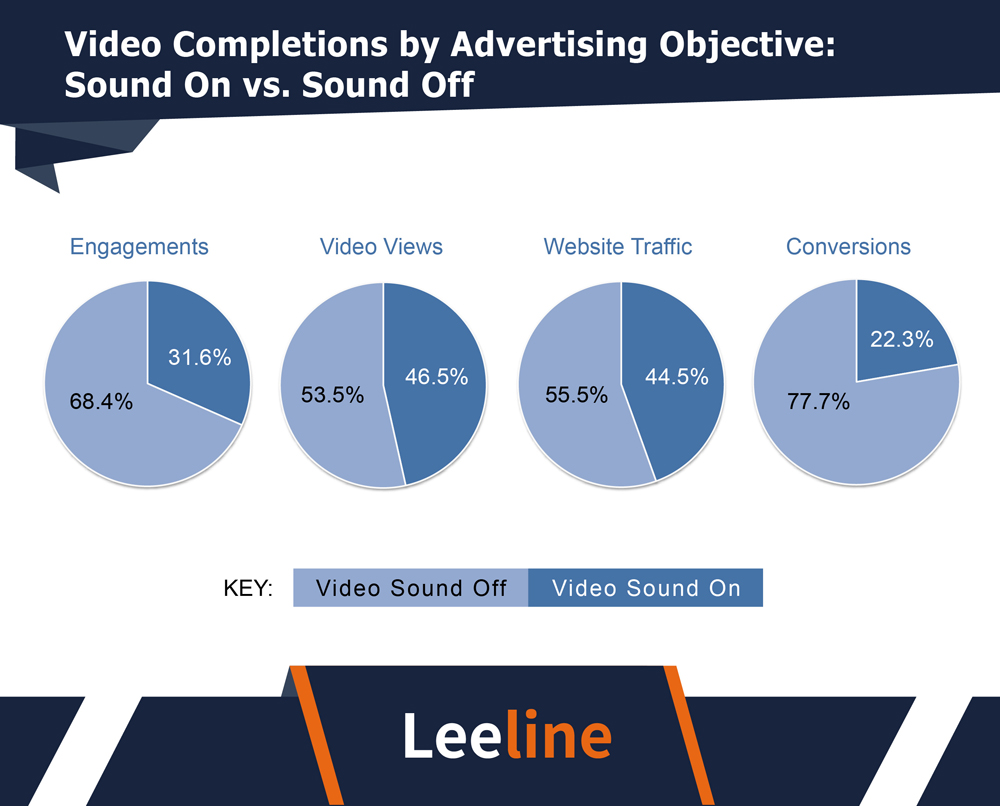
- Most Facebook users love the FACEBOOK posts without audio. For example, Facebook engagement without sound has been 68.4%. Compared to it, the engagement with audio has been 31.6%. Just check the contradiction.
- 53.5% of the FACEBOOK video views come from the sound-off videos. With video views, there have been 46.5% views.
- The WEBSITE traffic is another parameter to know. Without audio, there has been 55.5% of the WEBSITES. On the other hand, 44.5% have been with an audio.
- Conversion is quite Important for FACEBOOK advertising and marketing. Conversion without sound has been more. It is 77.7% without audio. There is a 22.3% conversion with audio.
Facebook Device Statistics
What do you use to access the FACEBOOK posts? For me, it is the mobile phone I use often. Less likely, I open the website.
The increasing use of MOBILE devices has raised views through smartphones. Initially, Facebook was introduced as a website. But now you get access through the app and website both.
Guess which users will be the MOST?
Let’s take a look at the data about this.
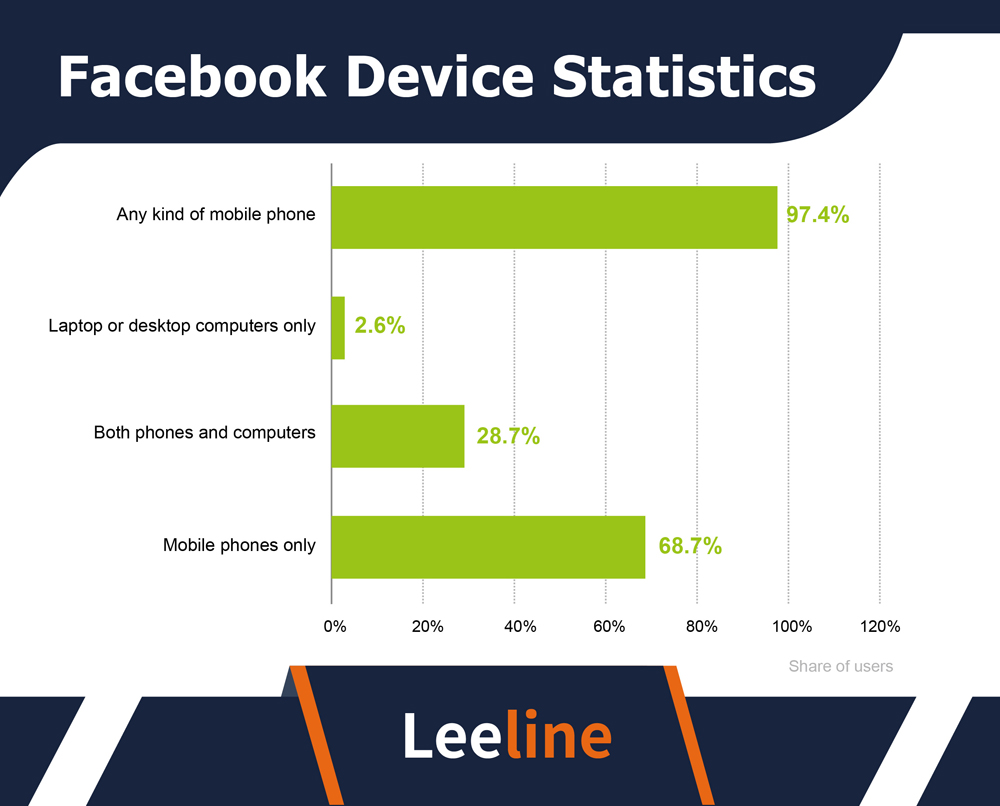
- 97.4% of the ACTIVE FACEBOOK users access Facebook through any phone. That means they can use the website on their phones. Or install the Facebook App to use this social network.
- Only 2.6% of the users came up with the DESKTOP or laptop for Facebook. They browse Facebook on Google or any other search engine.
- 28.7% of FACEBOOK users use the BOTH phone and computer. They can access link posts or Facebook videos with ease. Therefore, some use smartphones. At the same time, others might use the desktop.
- Most FACEBOOK users solely rely on their smartphones. According to data, 68.7% of the users do so. They do not use desktop computers to access Facebook. They use their MOBILE devices only.
Facebook Shopping Statistics
Facebook has the NUMBER platform for shopping also. TikTok has now touched it a little but is still the number one.
Let’s know how US buyers use social platforms for shopping.
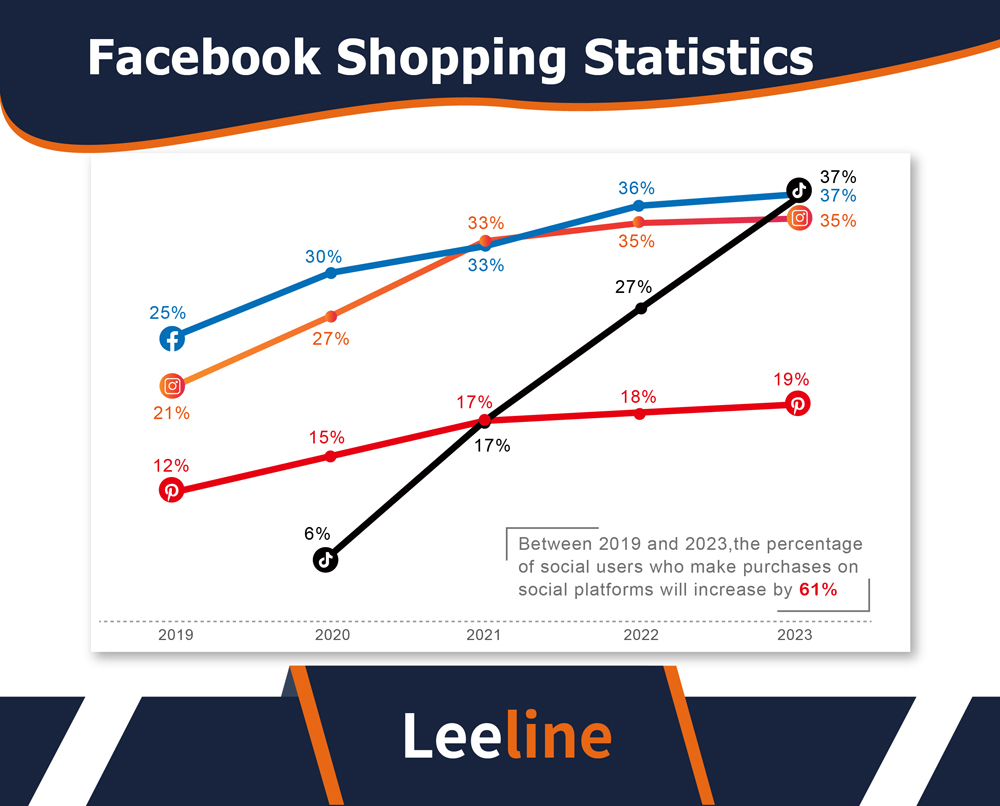
- In 2023, 37% of the US users use Facebook for shopping. It is the NUMBER ONE site for shopping recommendations.
- TikTok is also the NUMBER one competing with Facebook. 37% of the users also use TikTok to modify their PURCHASE decision.
- 35% of the users use Instagram. It is their SECOND-most favorite platform for buying.
- Only 19% have interest in the PINTEREST for making the purchase.
Facebook Ad Statistics
Facebook is not ONLY TREAT for the users but also the FACEBOOK advertisers. Business target AUDIENCE on a SOCIAL media landscape. And a social media platform with 2.9 billion is a HUGE OPPORTUNITY.
That is the secret sauce behind the HIGH success of Facebook advertising. So, do you want to advertise on FACEBOOK? Wait a minute. Take a look at the data variation in the reach of the FACEBOOK.
Here are detailed aspects of the data.
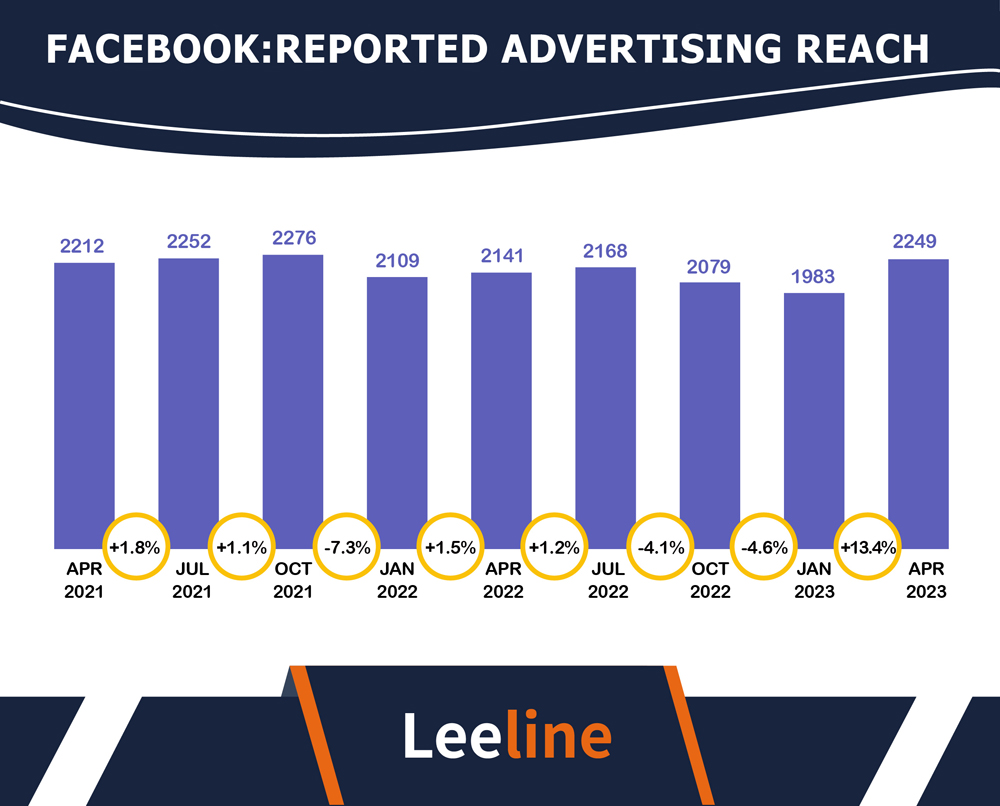
- In April 2021, FACEBOOK ads reached 2.21 billion Facebook USERS.
- In July, it noticed an increase of 1.8%. The Facebook ads reached 2.25 billion FACEBOOK users.
- In October 2021, it again noticed an increase of 1.1%. Now, the FACEBOOK ads have reached 2.27 billion Facebook users.
- From OCTOBER to January 2022, a constant decrease has occurred over the months. The FACEBOOK ads reached 2.109 billion users. There was a noticeable decrease of 7.3%.
- In April, it showed an increase of 1.5%. The Facebook ads reached 2.14 billion FACEBOOK users worldwide.
- In July 2022, there will still be an increase of 1.2%. The Facebook ads reached 2.16 billion Facebook users.
- From. From July to October 2022, Facebook has been unfortunate. There was again a decrease of 4.1%. The Facebook ads reached 2.07 billion users.
- Till Jan 2023, there was still a noticeable decrease of 4.6%. The Facebook ads reached 1.98 billion users.
- 2023 has a GOOD LUCK for Facebook. Do you know why? From January to April 2023, there was a consistent increase in Facebook ads. 2.24 billion FACEBOOK users accessed the Facebook ads. And above all, it was an increase of 13.4%. Isn’t it GREAT progress compared to previous years?
Facebook Revenue Statistics
Facebook ads revenue has seen ups and downs. It increased in some years while decreasing in others.
One thing is for sure: it has a LONG-TERM increase chart. Facebook makes a significant portion of money just from marketing ads.
Here is the data.
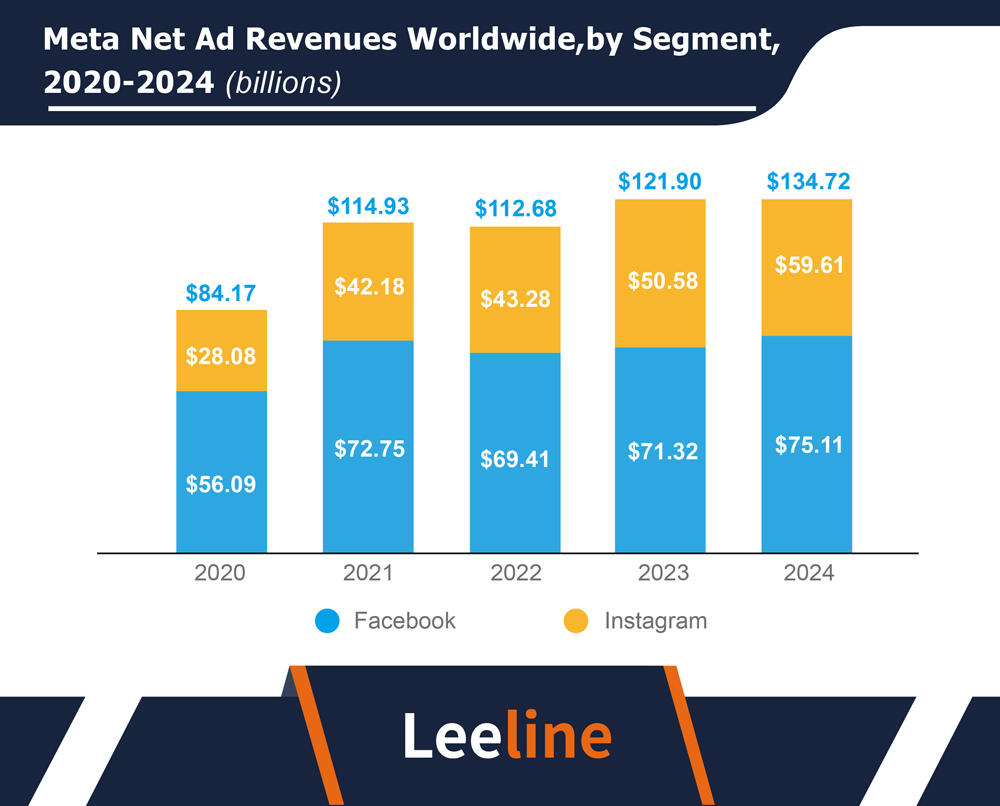
- In 2020, Facebook’s average revenue was 56.09 billion USD.
- In 2021, it showed an increase reaching 72.75 BILLION USD.
- In 2022, it showed a SLIGHT DECREASE. Overall revenue was 69.41 billion USD.
- In 2023, it has climbed the 70 BILLION mark again. It is now 71.32 billion USD.
- In 2024, it is expected to hit the 75 BILLION USD mark.
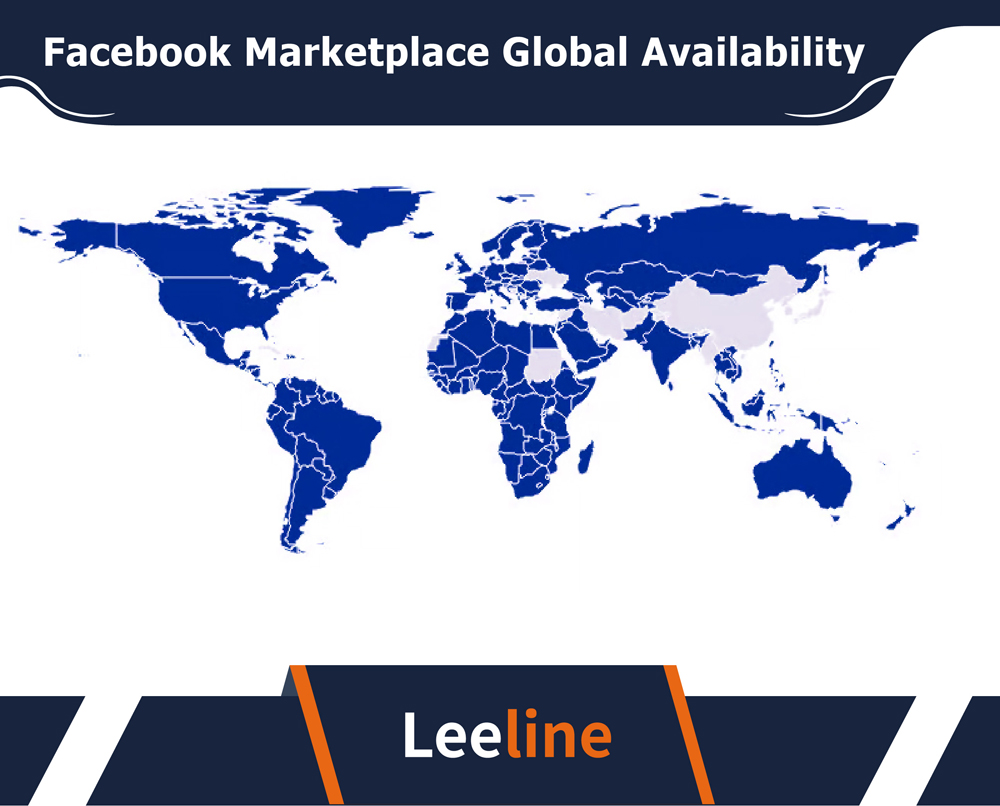
Facebook Marketplace statistics
Facebook is not a LOCAL SOCIAL media site with access to one or two countries. Instead, it has GLOBAL expansion. Some countries have millions of ACTIVE Facebook users. Some do Facebook advertising. At the same time, others rely only on the CONNECTION with the Family members or such purposes.
Whatever the purpose of using FACEBOOK is, it has got you. Facebook has access to 200+ countries. ASIA is the number REGION for it.
Let’s check the list of countries
- Most number of Facebook users are from India. Some stats say about 350 million plus active FACEBOOK users are from India.
- After India, the second rank goes to the US. There are 179 million ACTIVE Facebook users in the US.
- Indonesia has the Third rank regarding the number of ACTIVE Facebook users. According to the data, it has 130 million users.
- Brazil comes in the FOURTH rank for active Facebook users. There are 115 million users from the BRAZIL.
- 37% of the NORTH Americans use Facebook. They do so for the SHOPPING purposes. And come up with better deals through the Facebook audience.
What’s next
Facebook is a social MEDIA GIANT with 2.9 billion users. Sooner or later, it will touch the 3 billion.
Time spent is QUITE MARVELLOUS. An average user spends 30+ minutes. That is great.
Do you want to know more statistics like that? Follow our website for the latest data about different sites.